
Data Transformation
Raw data isn't insights.
It's noise.
SourceMedium cleans, models, and enriches your data so every team works from the same numbers. No more arguing about which report is right.
- Clean it - fix inconsistencies, standardize formats, remove junk.
- Model it - organize data into tables your team can actually query and report on.
- Enrich it - fill in gaps like product costs, attribution, and channel mapping.
Stop being a data janitor.
Your analysts should be finding growth opportunities, not fixing timezone errors or debugging why two reports don't match.
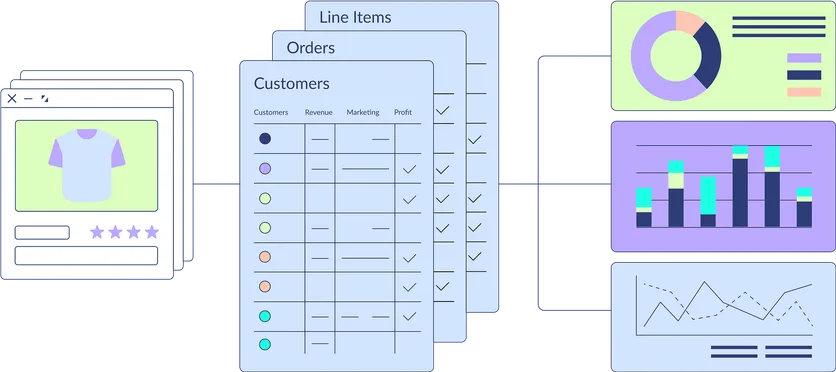
Three layers of transformation quality
Cleaning, transformation, and enrichment each solve a different problem.
Data cleaning
Focuses on data quality: removing what doesn't belong and standardizing the rest.
- Merging fields from Shopify, ad platforms, and analytics into one consistent structure
- Fixing timezone mismatches so reports are not off by hours
- Catching bad data automatically with 2,500+ daily quality checks
Data transformation
Focuses on usability: converting raw data into tables your team can actually work with.
- Business-ready tables for dashboards and recurring analysis
- Building-block tables for data teams who want to customize
- Aggregated rollups for executive reporting and daily KPIs
Data enrichment
Focuses on completeness: filling in the gaps that raw data leaves behind.
- Product costs mapped at the SKU level so you can calculate real margins
- Channel and sub-channel groupings tailored to how your team thinks about marketing
- Marketing attribution stitched across multiple tracking sources (up to ~30% more coverage vs GA4 alone)
Attribution (including last-click, multi-touch, and survey-based models) is part of the enrichment layer. See how attribution works
Data tables by use case
Start with dashboards and reports. Go deeper only if your team needs to.
| What you need | What we provide |
|---|---|
| Dashboards + recurring analysis | Business-ready tables, pre-joined so your dashboards just work. Start here. |
| Executive reporting + daily KPIs | Aggregated rollups optimized for high-level dashboards and board reporting. |
| Custom analysis + segmentation | Tables for filtering and segmenting by product, geography, channel, and more. |
| Advanced modeling + data science | Raw event and transaction data for teams building custom analyses. |
Most teams only need the first two rows. Data teams who want full control can go deeper. The building blocks are there. See the dashboards
Buy vs. build options
Three common alternatives, and the trade-offs of each.
Building in-house
Full control, but you own every definition, test, and pipeline.
- Typical ramp: 6-12 months to reach stable, board-ready metrics.
Modern data stack (Fivetran + dbt + warehouse)
Maximum flexibility, but you assemble and maintain every piece.
- Works well if you already have a data team and strong dbt practice.
DIY dbt foundation
Strong for hands-on teams, but operating ownership stays with you.
- Who maintains definitions + tests when sources change?
- What breaks when your ecommerce platform ships an update?
- How long until you reach board-ready numbers?
Quality and consistency controls
- Documented and consistently named fields so teams can query without translation work.
- Designed to stay stable as source schemas evolve, reducing dashboard breakage.
- 2,500+ automated quality checks run daily to catch drift before it reaches reporting.
Practical outcomes
- Consistent metric logic across dashboards, warehouse queries, and AI workflows.
- Reduces 'Meta says X / Shopify says Y' gaps by applying a documented attribution hierarchy and reconciling sources.
- Lower analyst rework from definition drift and ad-hoc field cleanup.
Attribution Source Hierarchy
How SourceMedium prioritizes attribution signals when sources disagree or are incomplete.
Cleaning vs. Transformation
Understand the difference between data cleaning and data transformation.
Modeling Philosophy
How SourceMedium names, shapes, and organizes transformed tables.
Next steps
Data transformation is the middle layer. Here's what comes before and after.
Ready to stop debating the numbers?
Get started
Tell us a bit about your brand and stack—we’ll follow up shortly.
You're all set