Reporting your team will actually use.

Production-grade Looker Studio templates running on BigQuery, built across hundreds of e-commerce brands. Fork them, edit them, extend them with your own data.

Production-grade
Fully editable
Bring your own data
Portable
Explore template

Executive Pace Board

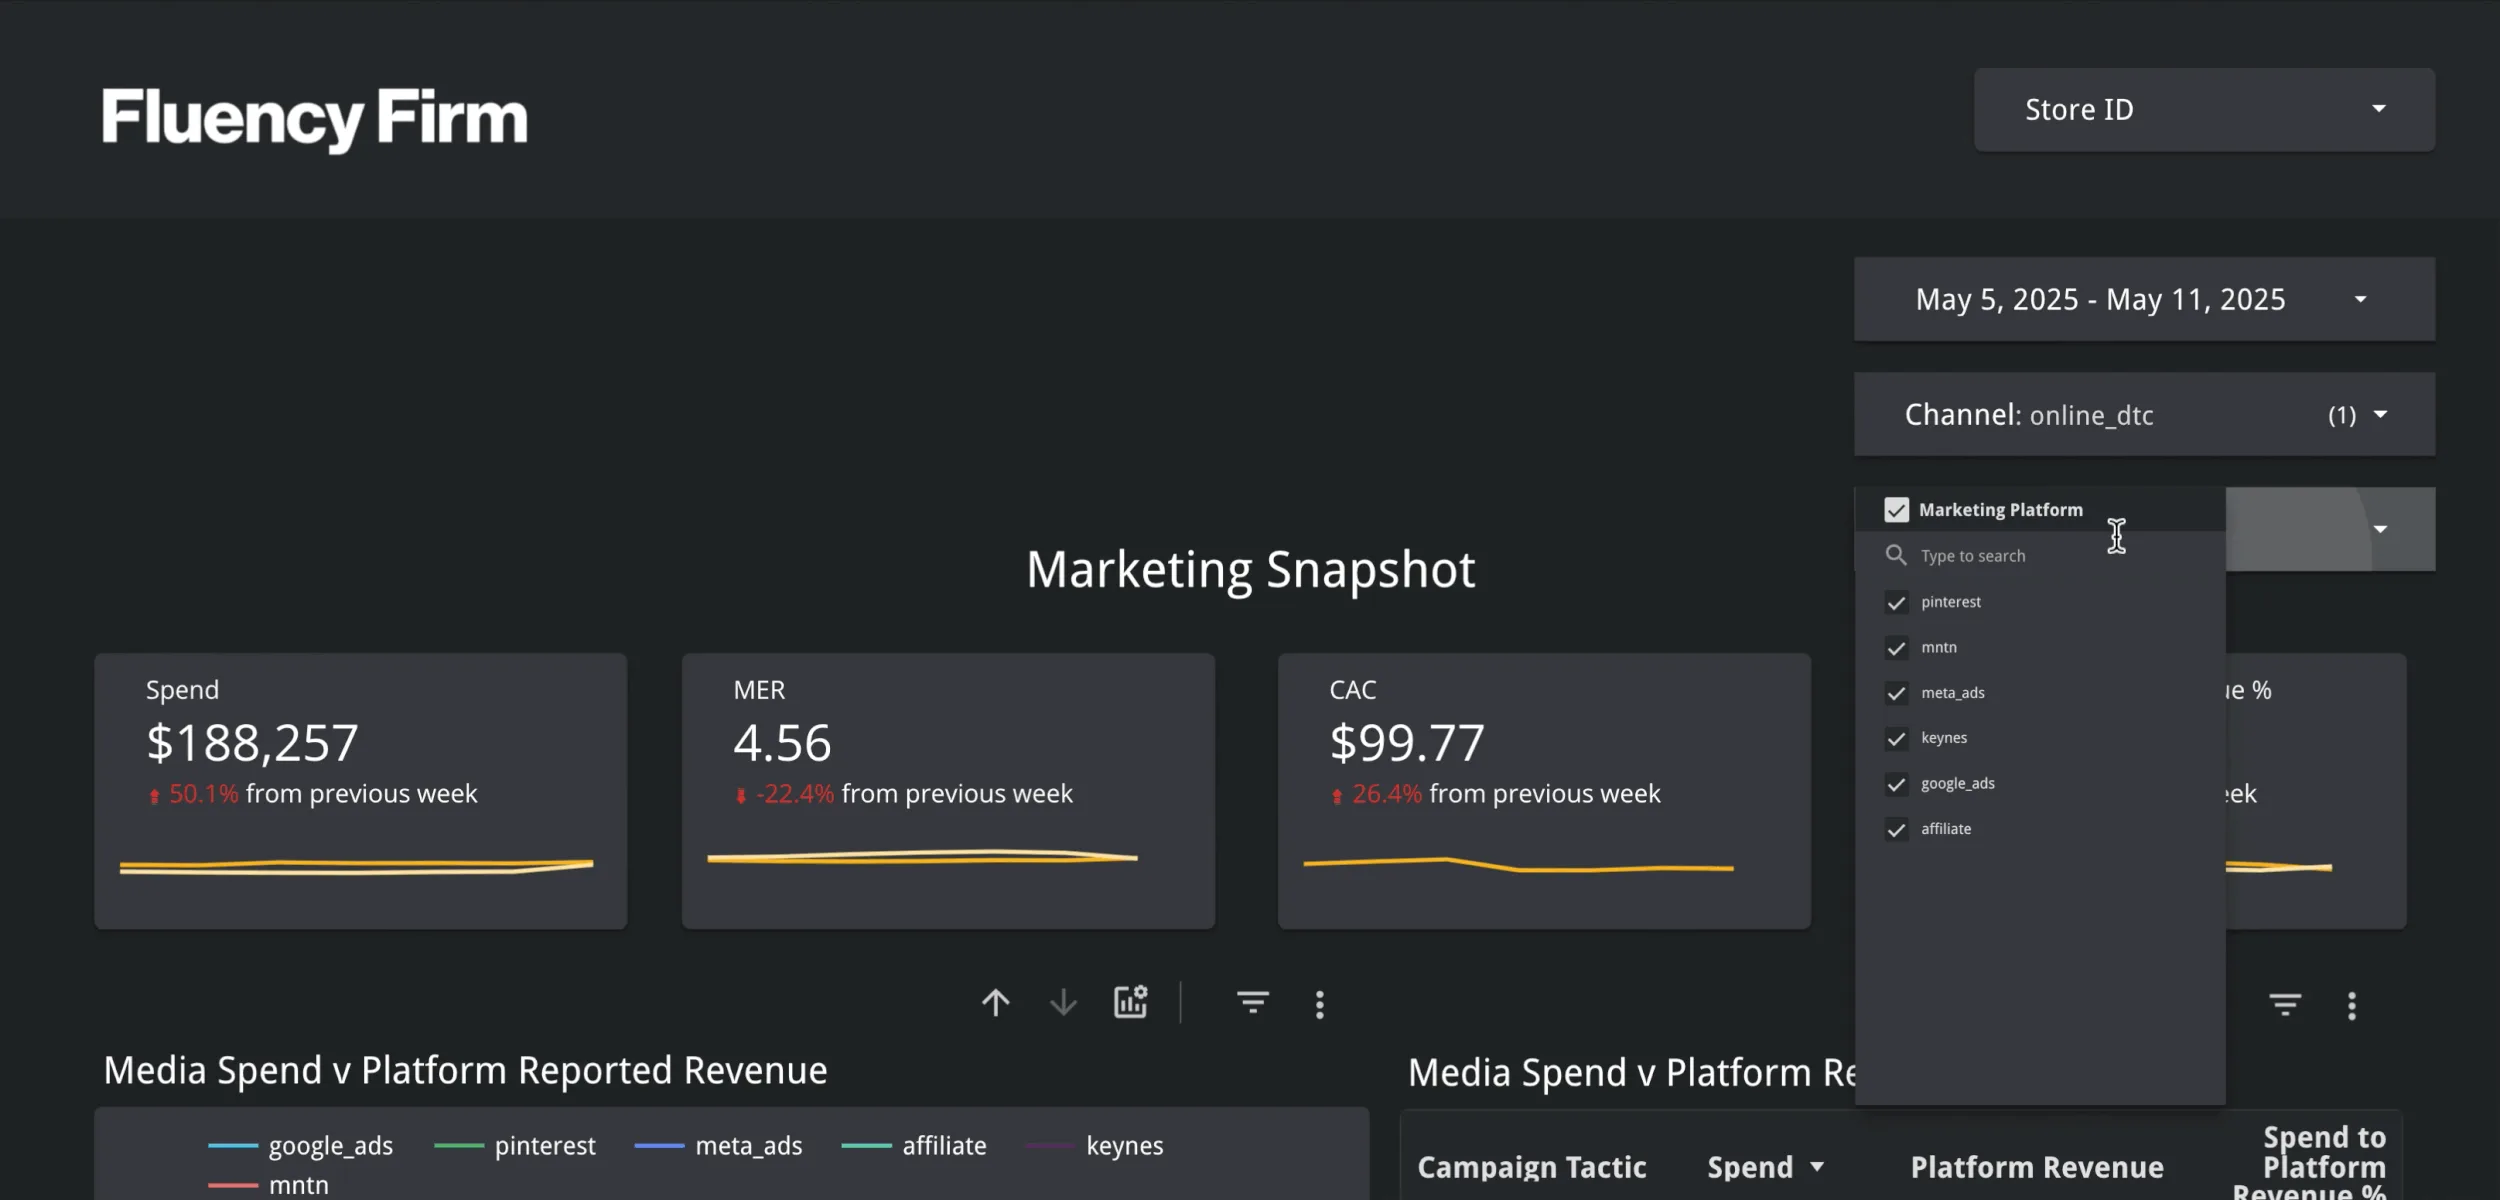
Align weekly decisions around one KPI, trend, and variance view.

Executive Summary
Executive Summary view with KPI cards for revenue, AOV, CAC, and new customers
KPI snapshot cards.

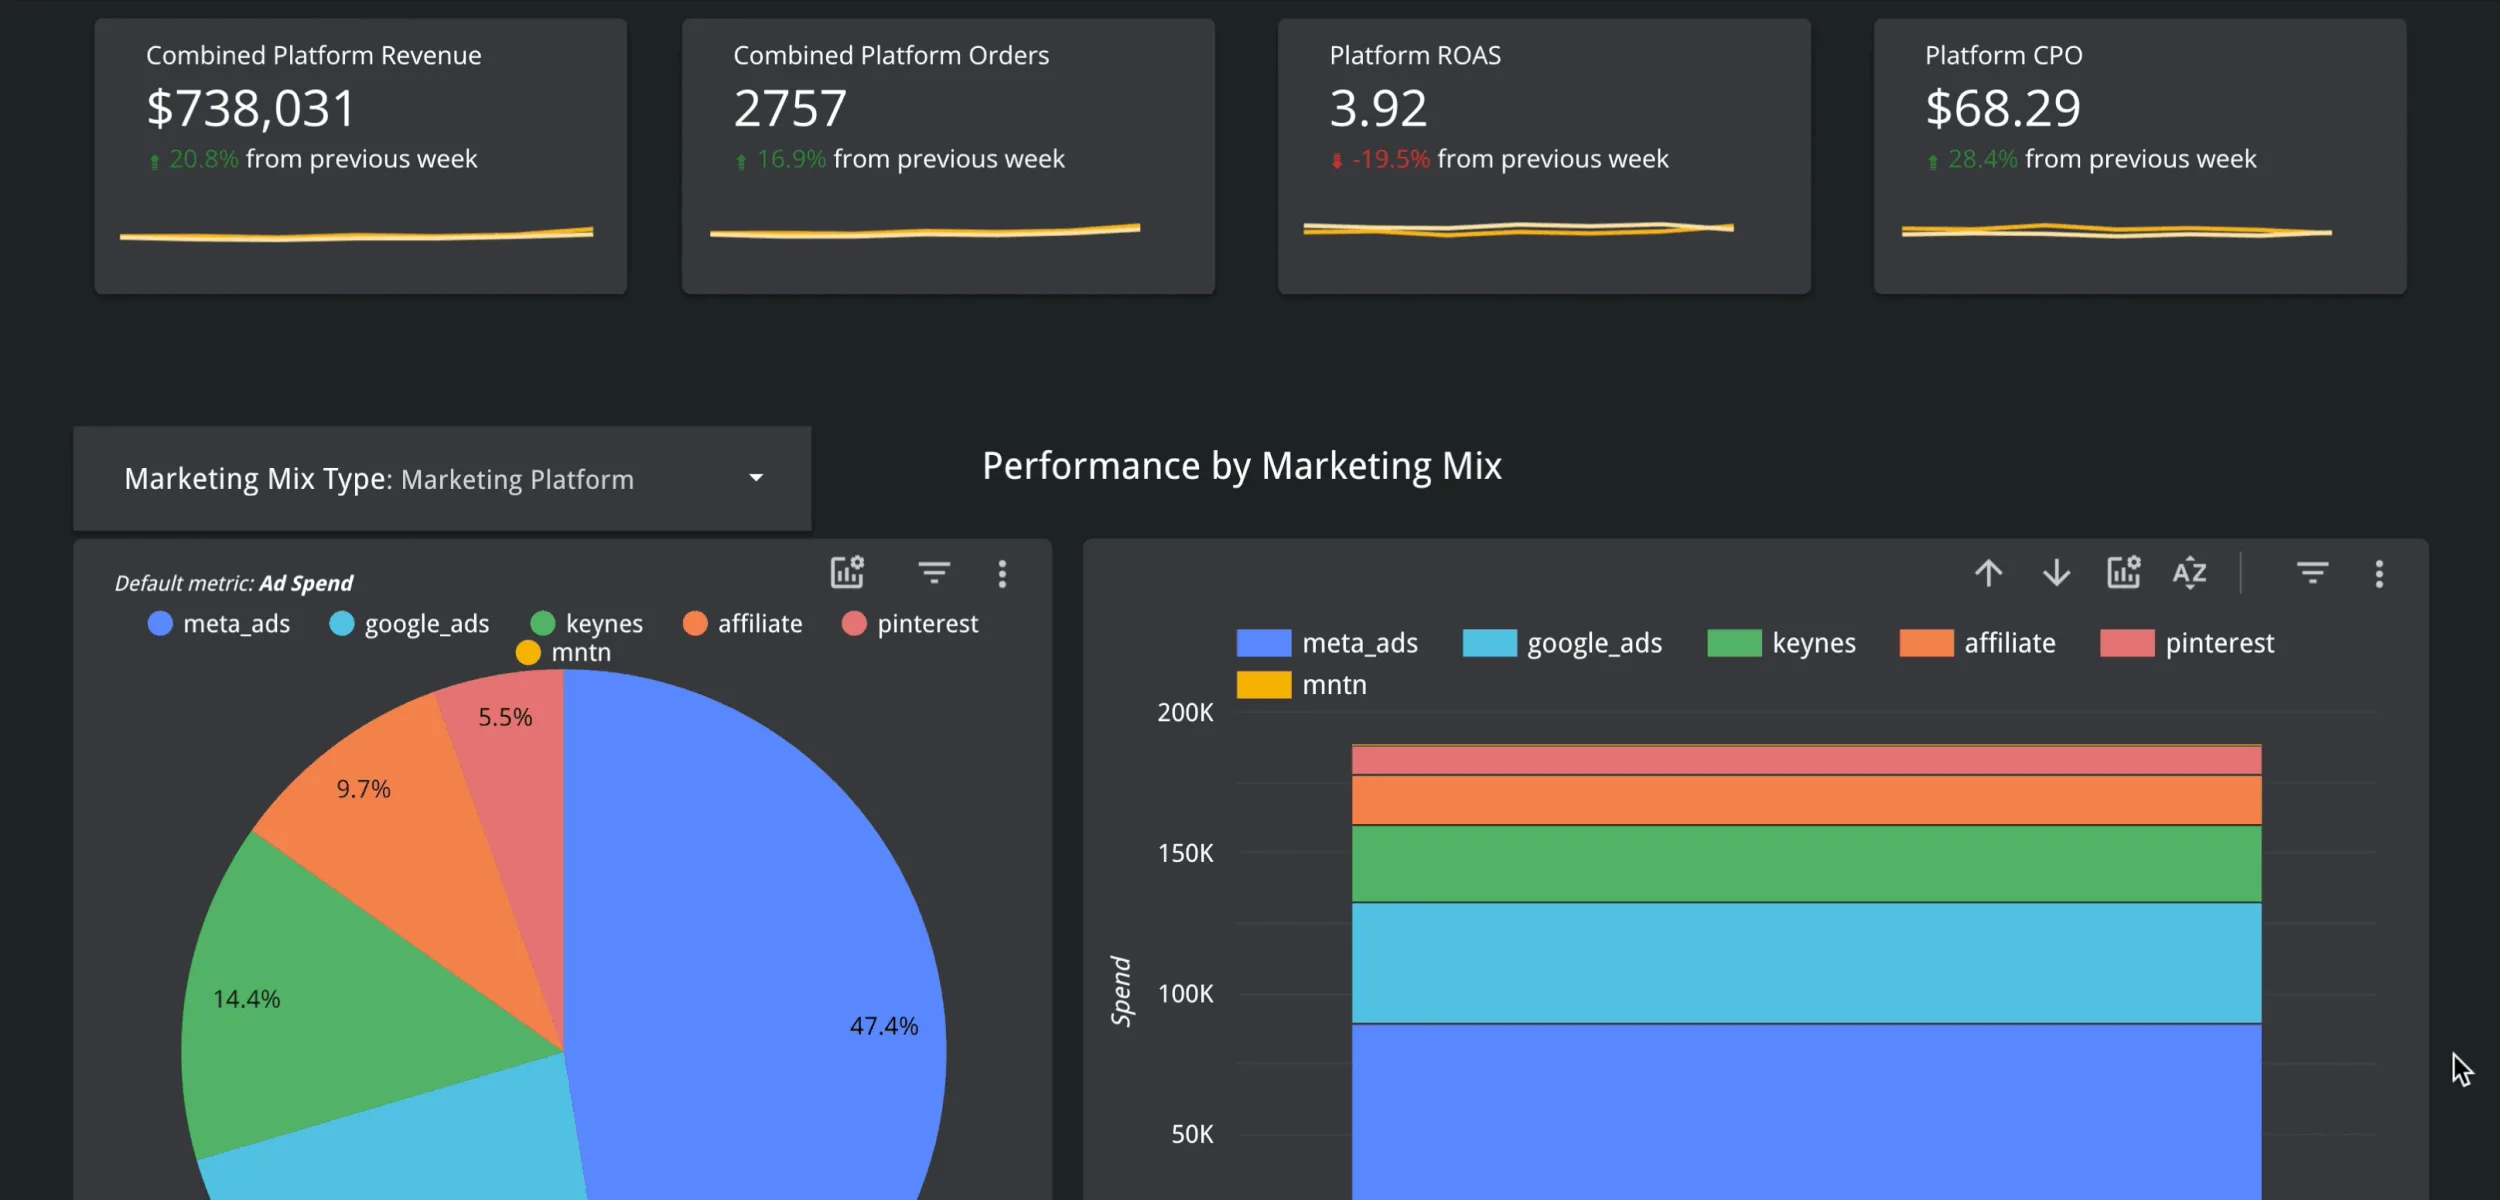
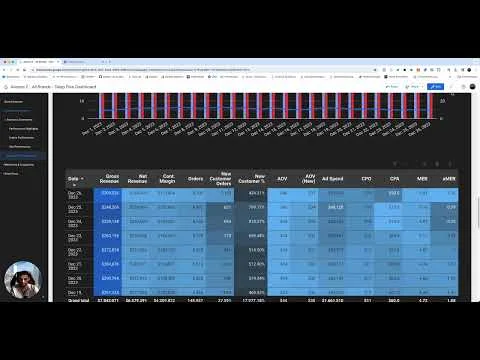
Weekly KPI pacing and variance signals for faster leadership calls.

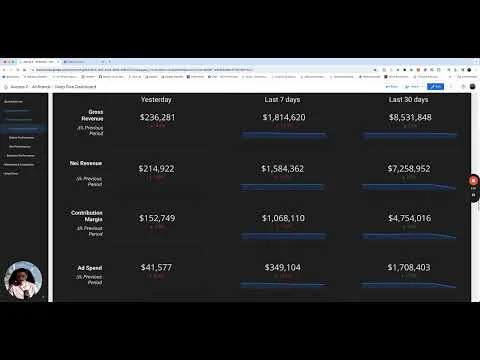
  • Which KPI cards are off weekly plan, and by how much?
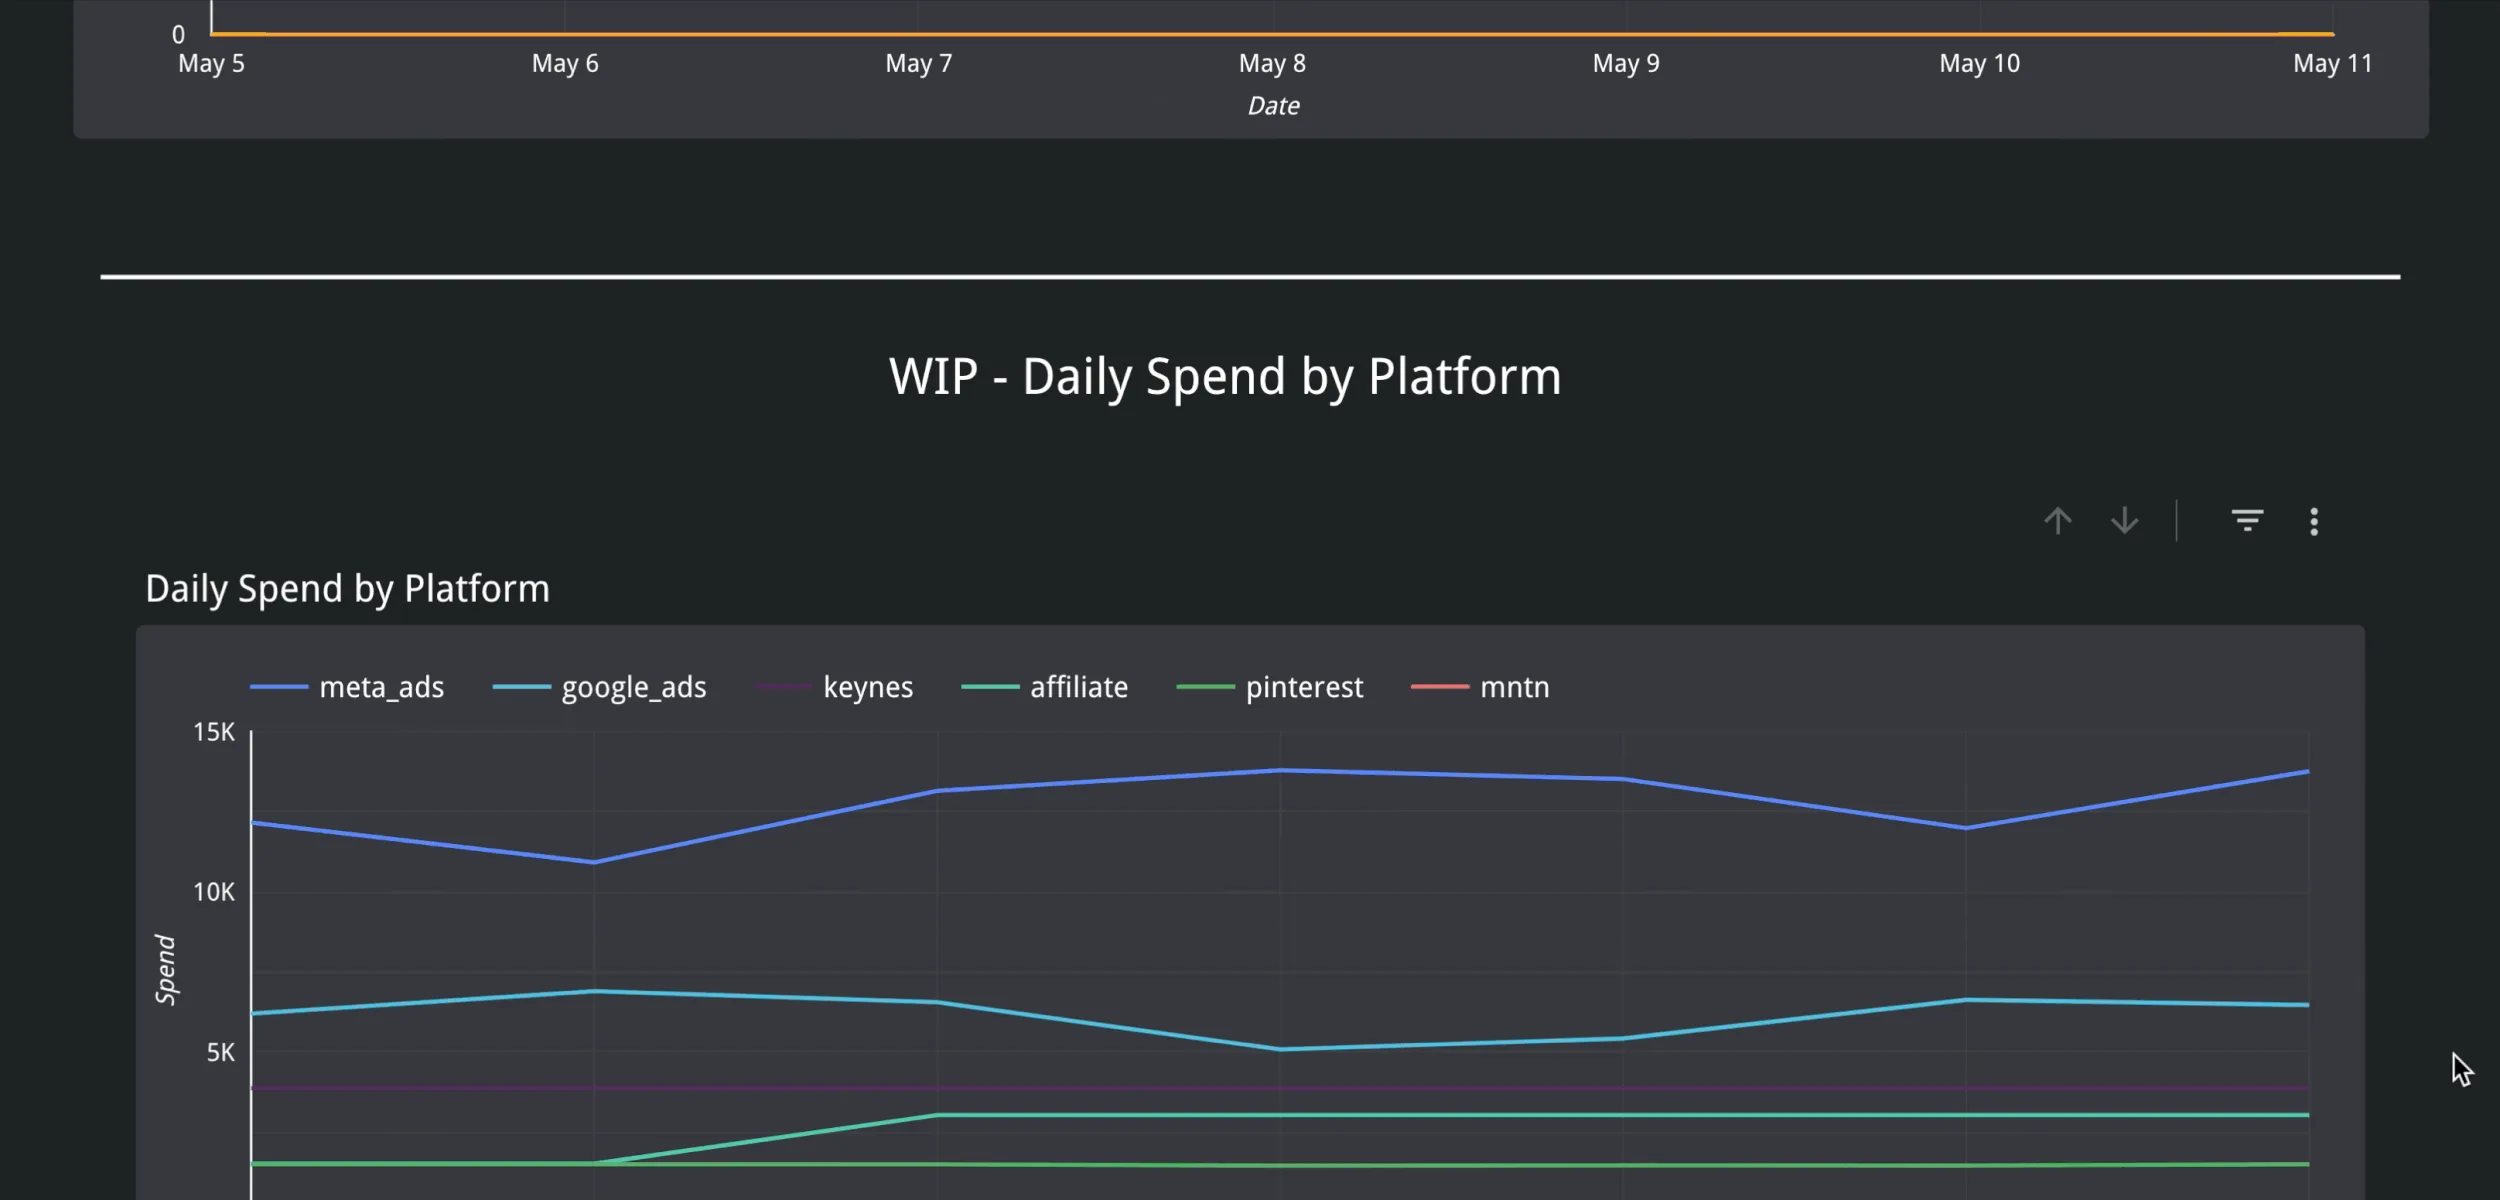
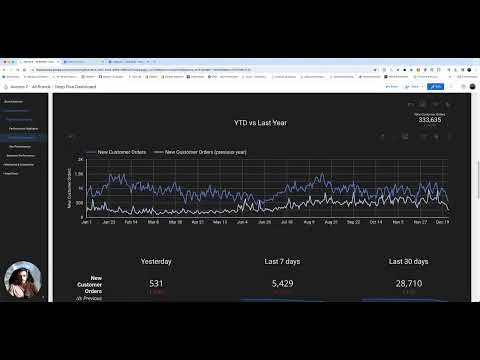
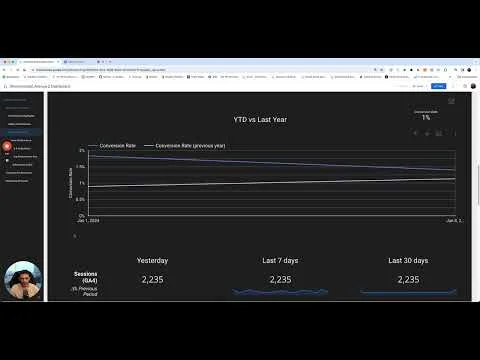
  • Are daily trend lines signaling a real shift or short-term noise?
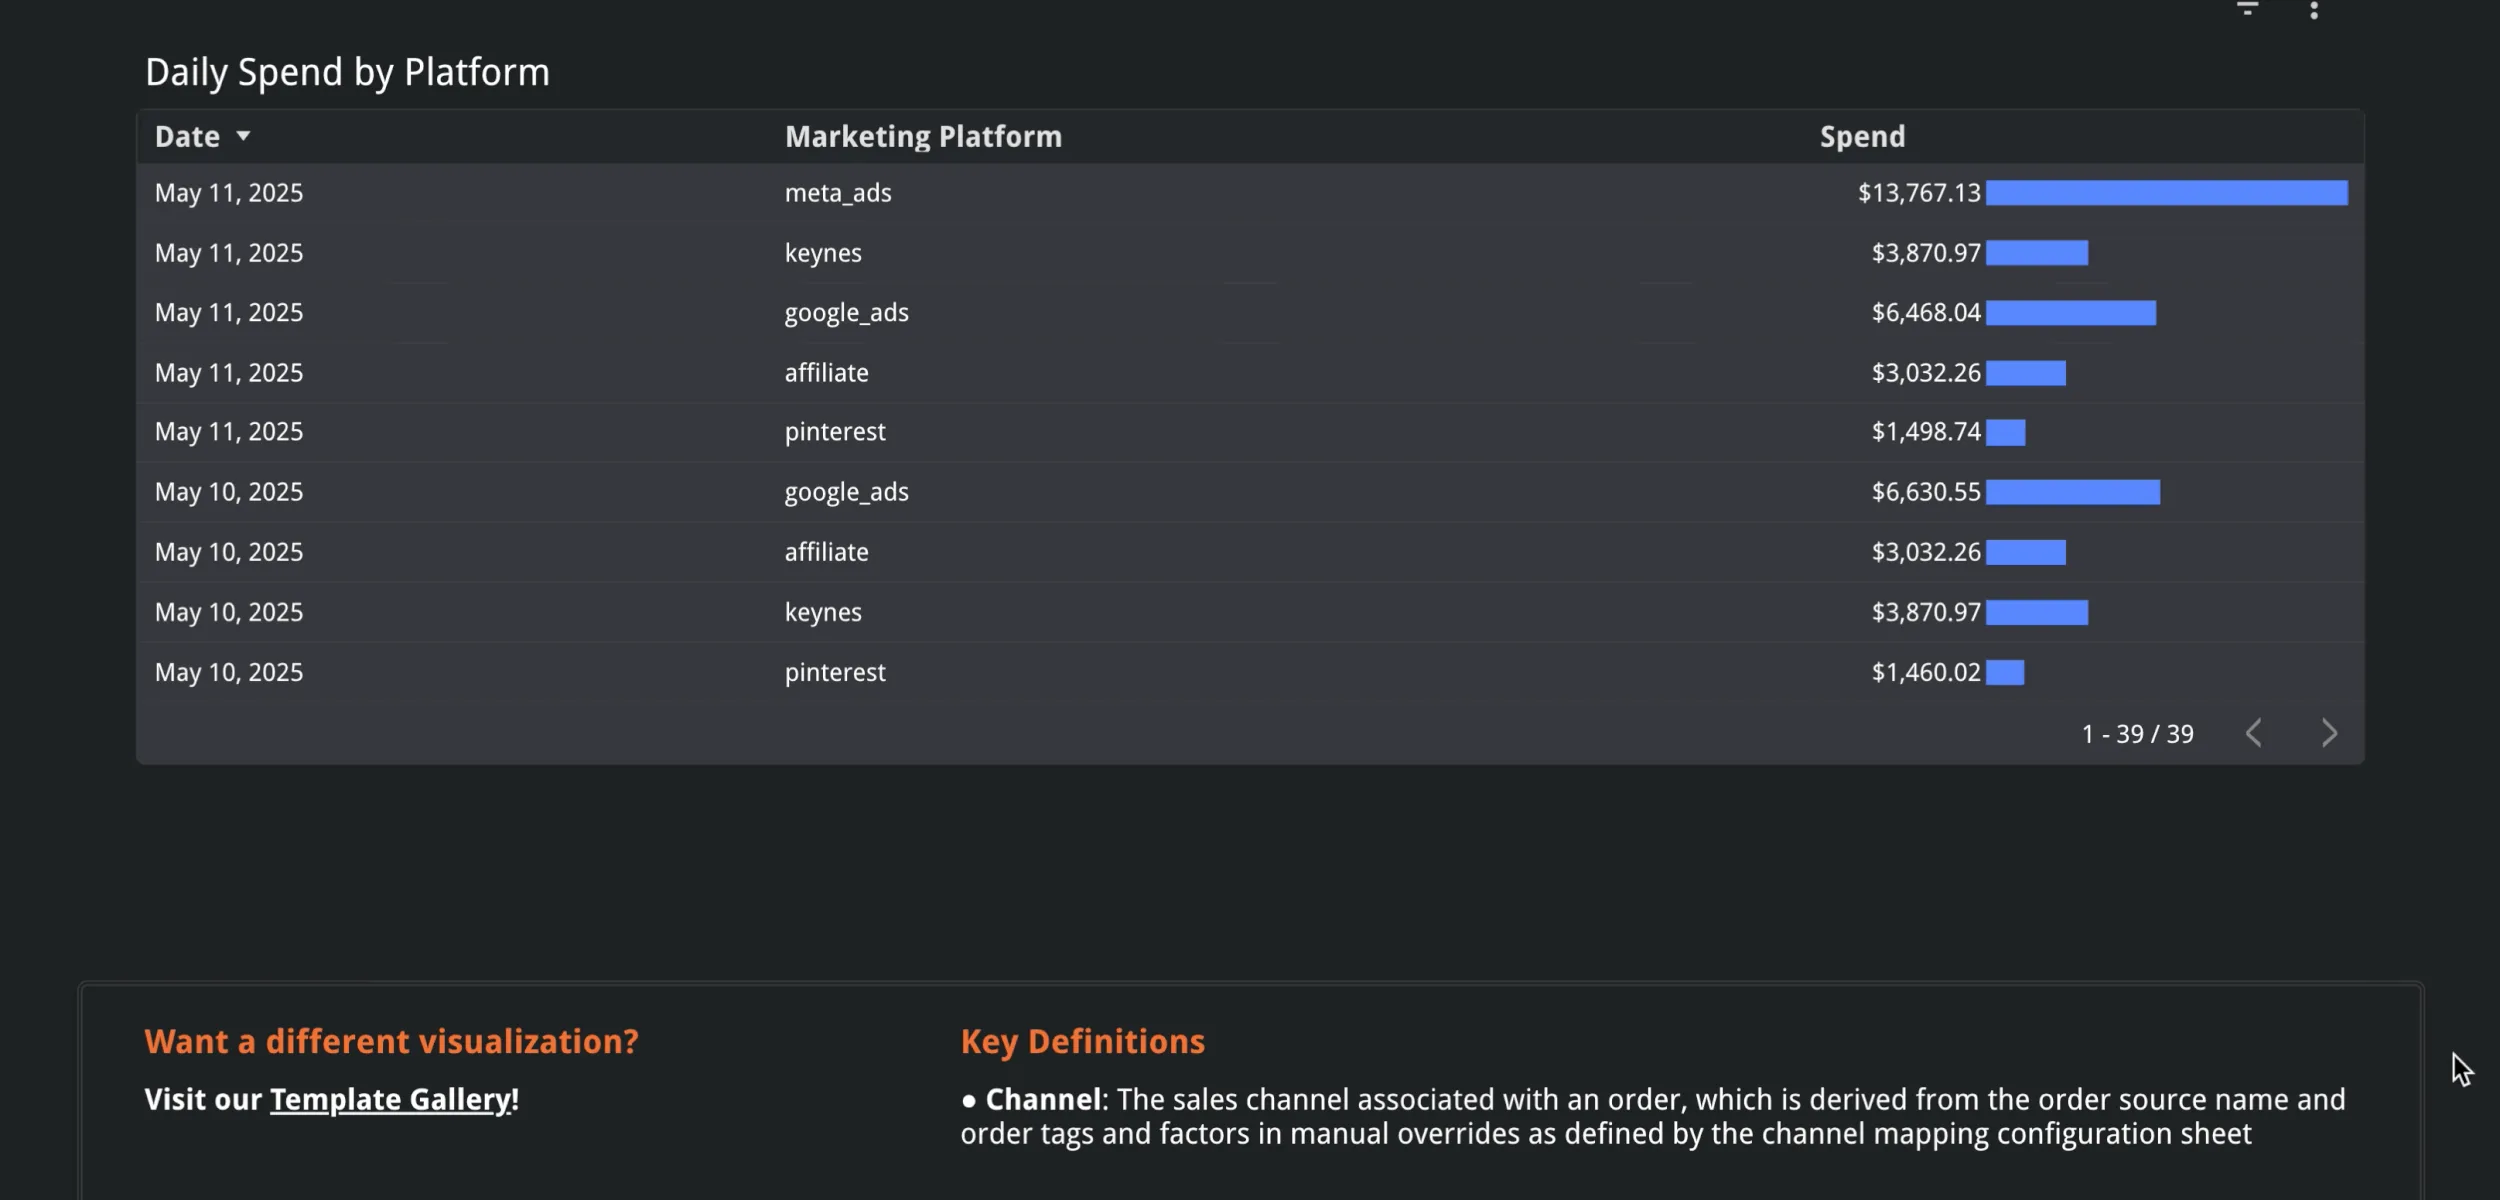
  • Which rows in the exportable table explain variance fastest?

Use ours. Build yours.

Start with our template, or launch your own white-labeled dashboard. These partner builds show what is possible.

Built fully custom

FluencyFirm created a distinct dashboard interface on the same SourceMedium foundation.

  • A fully branded UI can still run on shared modeled data and QA logic.
  • Teams can design around their own cadence, KPIs, and client communication needs.
  • You are not locked into one visual template.

“We spent months evaluating attribution tools for our clients. What sold us on SourceMedium? They don't add another pixel or tracking layer. They just make sense of the quality data you're already collecting. Clean, auditable, actionable.”

Template or custom, your choice

Avenue Z built a white-labeled reporting experience on SourceMedium infrastructure.

  • Start from the default template, then reshape the UI to match your agency system.
  • Trusted definitions stay intact while the experience becomes fully branded.
  • Use these builds as inspiration for your own dashboard layer.

“We push all our clients toward server-side tracking for data quality. SourceMedium turns that investment into actionable insights. It's the perfect complement to probabilistic models - giving us deterministic validation of what's actually working.”

Integrated BI-to-data stack on Google Cloud

SourceMedium
delivers
BI Layer
Looker Studio
+
Data Layer
BigQuery
on
Google Cloud Platform

Why Looker Studio.

The most-used BI platform in e-commerce: free, mobile-ready, with 1,000+ connectors and enterprise security.

1,000+ connectors, zero middleware

Native connectors for GA4, Google Ads, BigQuery, and Sheets, plus 1,000+ community connectors. No third-party middleware or ETL layer required.

Free for your whole team

No per-seat BI licenses. Unlimited dashboards, unlimited viewers. Share with your team the same way you share a Google Doc.

Blend sources without SQL

Combine up to five data sources per chart (BigQuery tables, Sheets, GA4, ad platforms) with drag-and-drop joins. No SQL required.

Enterprise sharing and security

Google Cloud Identity, granular permissions, audit logs, and Pro workspaces. Control who sees what without a separate admin tool.

Built for reporting and presentation

Drill-down filters, calculated fields, branded styling, scheduled email delivery, and embeddable reports. A real BI tool, not a screenshot.

Mobile app, mobile-ready layouts

Responsive layouts sized for phones and tablets, an iOS/Android app for on-the-go access, and touch-friendly filtering and drill-down.

FAQ

Can I edit these dashboards?
Yes. You fork a copy into your own Google account and open Edit Mode in Looker Studio: add charts, rearrange layouts, create calculated fields, and build custom formulas like AOV or YoY growth. It's a real BI tool, not a locked view.
Can we bring in additional data?
Yes. Data sources are additive: connect any BigQuery-compatible source, Google Sheets, or GA4 alongside your existing modules. Your current dashboards keep working while you layer in new sources.
Will numbers match Shopify and ad platforms exactly?
When variance appears, the shared definitions and QA layer make the reason clear.
What happens if we ever leave?
You keep your BigQuery tables, copied dashboard reports, and SQL. No rebuild.
How is this faster than building from scratch?
You start with seven modules (executive through data dictionary) running on stable definitions, not a blank BigQuery project. Teams begin with a working foundation instead of spending months assembling tools before anyone trusts the numbers.
Can my whole team access the dashboards?
Dashboards use Owner's Credentials, so your team can view and filter without individual BigQuery setup. Editors can modify charts and formulas with the right permissions.

Dashboard customers

“The first tool I open every morning.”

“The open-source dashboard templates provided by SourceMedium are simply the best in the business. The ability to fully customize and edit these dashboards internally has given our teams the flexibility and agility they need to make informed decisions quickly on behalf of our clients.”

“SourceMedium's intuitive design provides us with a clear view of our KPIs and is what our team relies on for daily decision making. Really impressed with the product's ability to adapt and grow with us!”

“SourceMedium is our command center; it helps us identify problems before they get bigger. It's easy enough for everyone on the team to use, and it empowers all people.”

“Thanks to SourceMedium, our team no longer wastes time debating metric definitions in meetings. Instead, we can focus on what really matters: making informed, data-driven decisions that drive results.”

“Source Medium is an incredibly powerful dashboard that we use across our organization for daily reporting and decision making.”

“Source Medium is the first tool I open every morning. As a CEO it has become an integral tool to assess the daily health of the business and make long term strategic decisions.”

Ready to stop debating the numbers?

Get started

Tell us a bit about your brand and stack—we’ll follow up shortly.