

obt_purchase_journeys_with_mta_models and rpt_ad_attribution_performance_daily, both in the sm_experimental dataset.
The video below walks through the same steps.
1
Confirm your data is ready
Wait for confirmation from SourceMedium that your MTA tables are present in your warehouse. Then open the MTA template dashboard. If you cannot open it, contact SourceMedium.
2
Copy the template and select your data sources
On the template, open the three-dot menu at the top right and select Make a copy.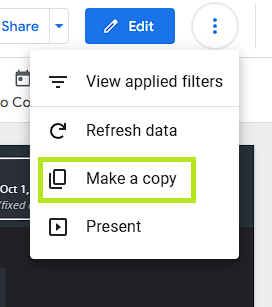
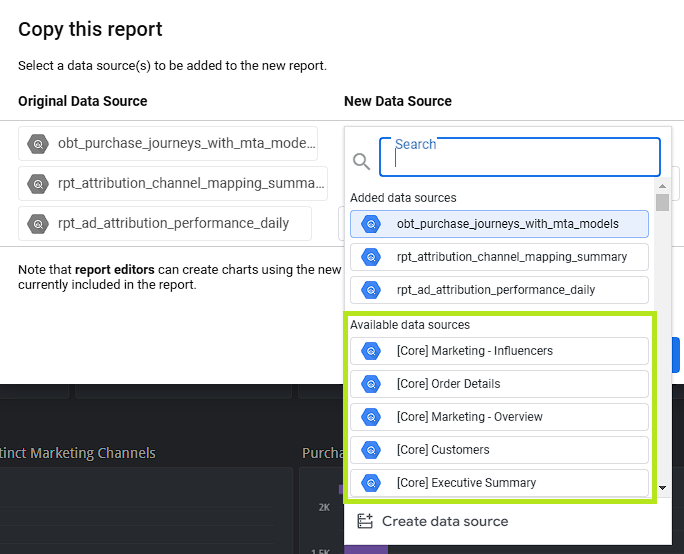
3
Create missing data sources
Click Create data source.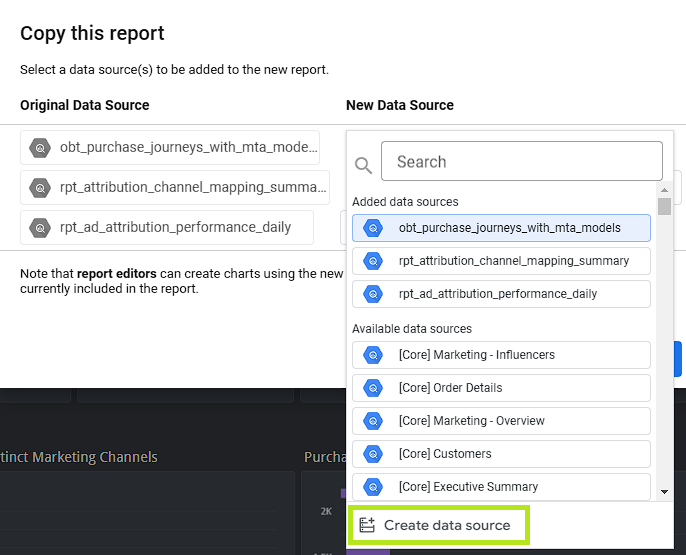
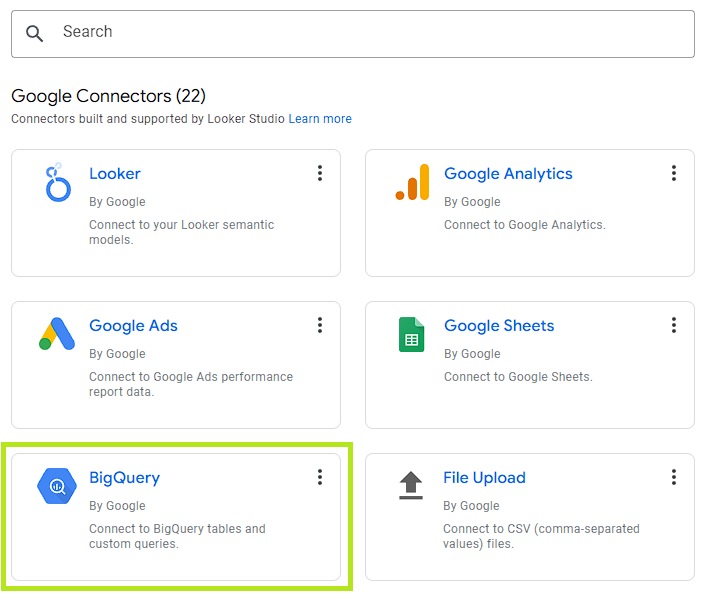
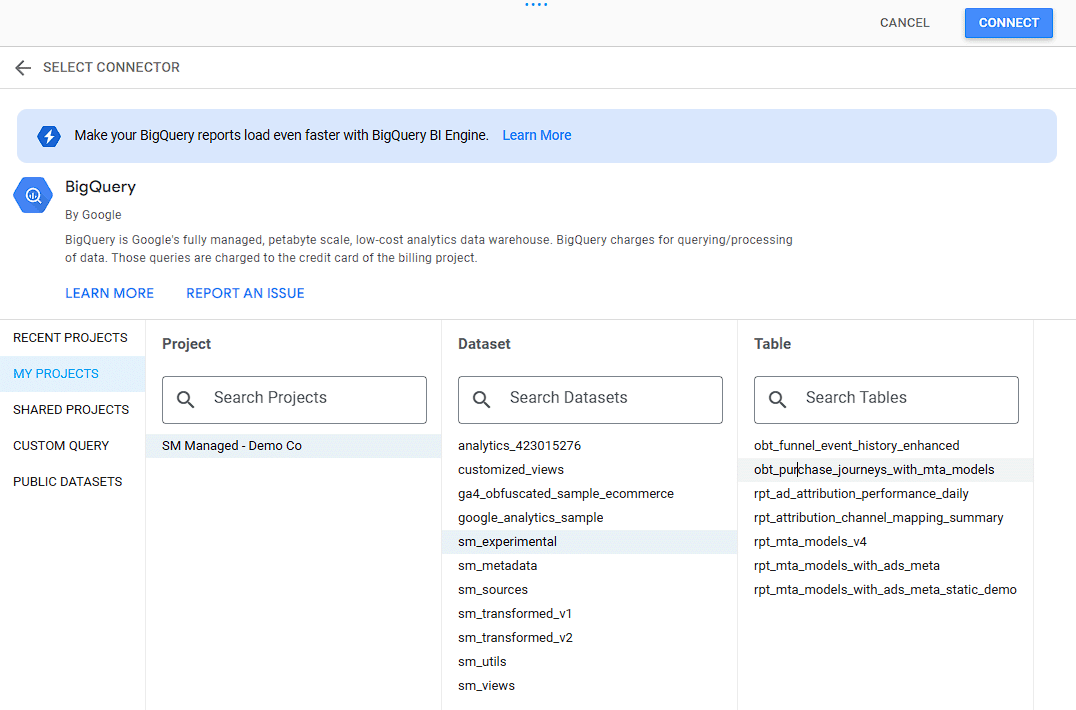
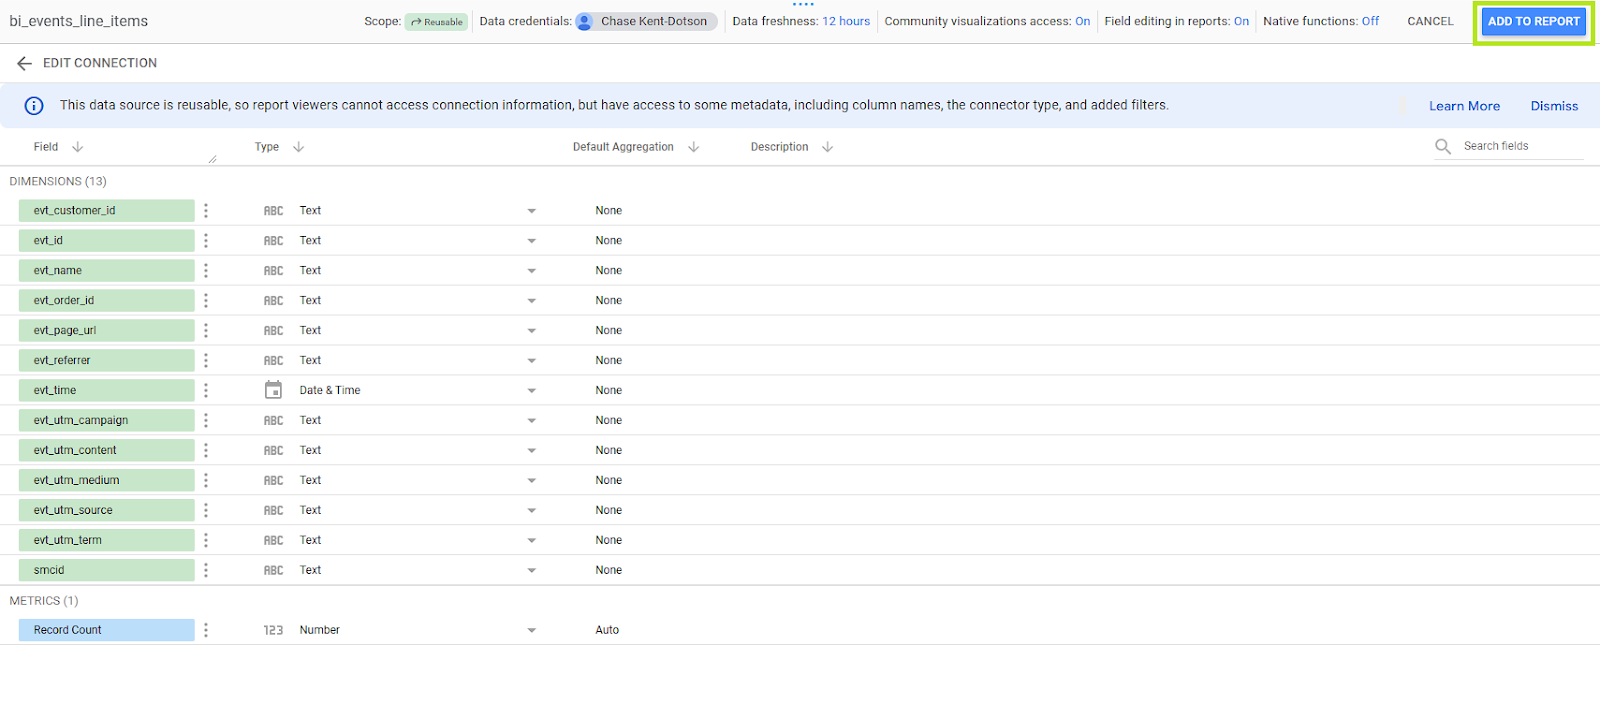
- Project: SM Managed - Your Company Name
- Dataset: sm_experimental
- Table: obt_purchase_journeys_with_mta_models or rpt_ad_attribution_performance_daily
4
Personalize your copy
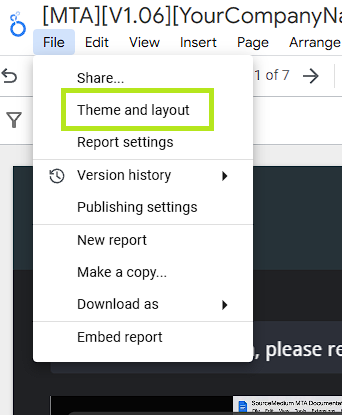
Click Copy Report. Looker Studio opens your new dashboard in edit mode.Rename the report in the top left. Remove Copy of and replace Demo with your company name.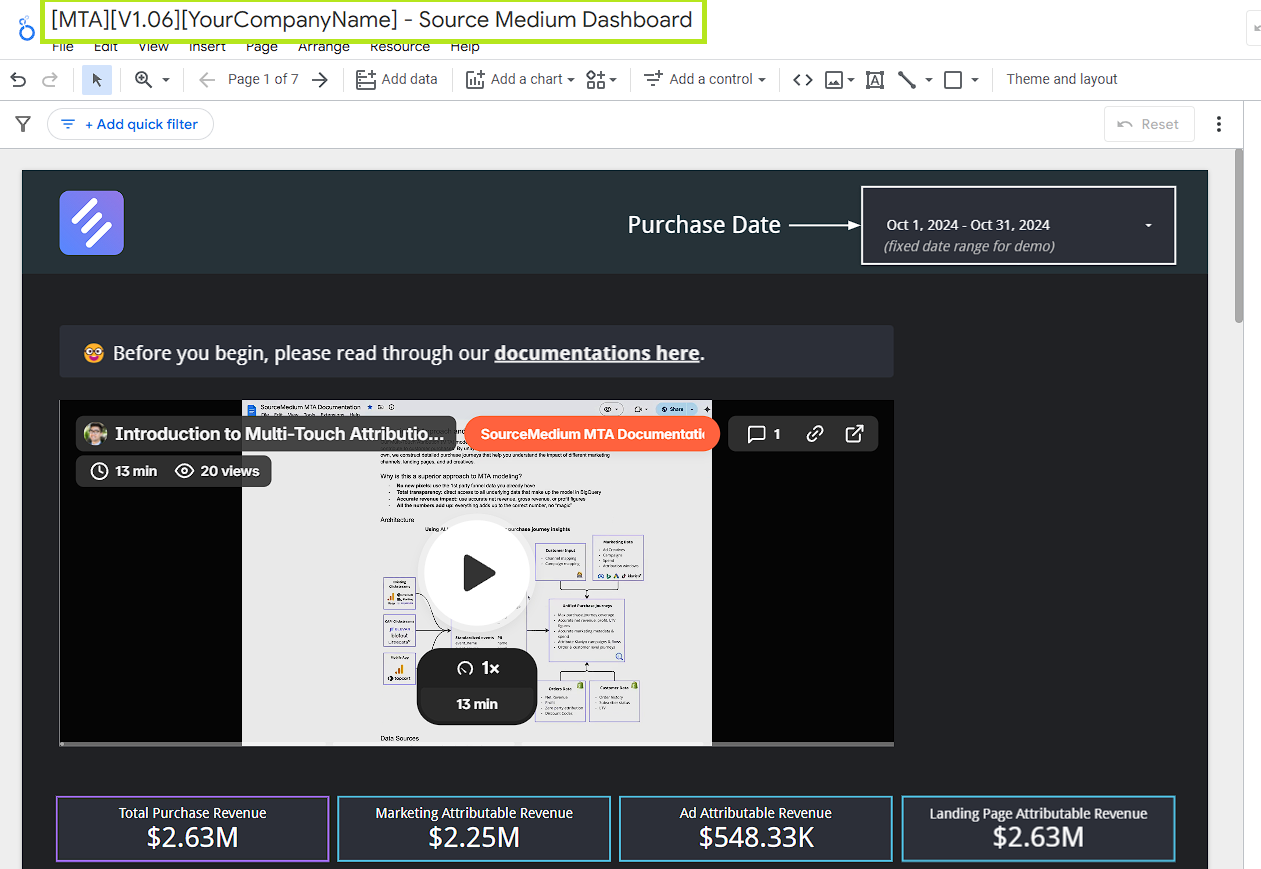
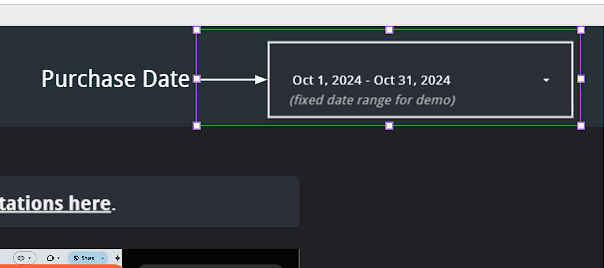
 To replace the SourceMedium logo, click it, then click the file name in the Image Properties panel and choose your own file. The logo is shared across pages, so you only do this once.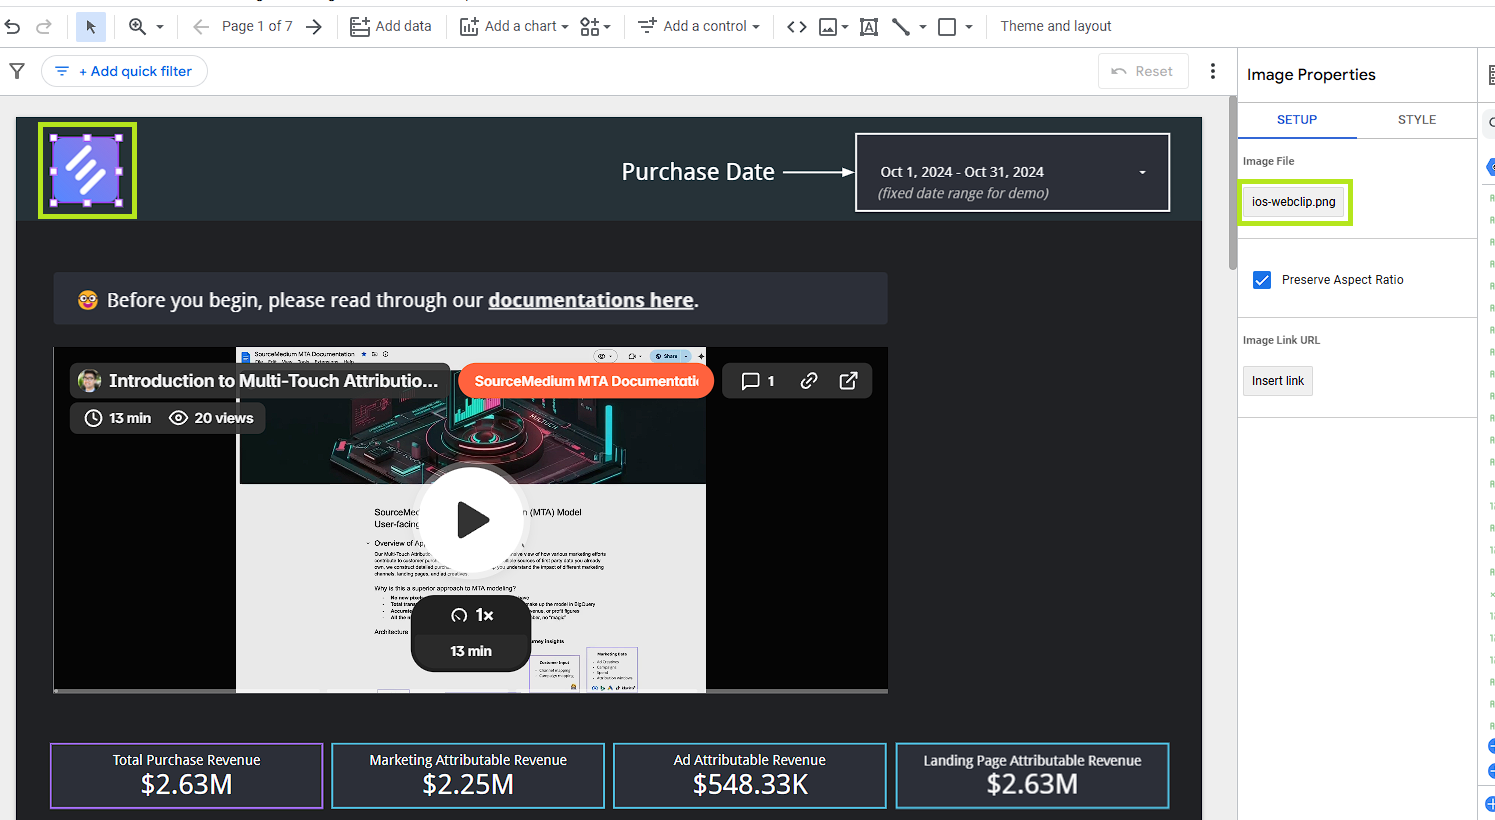
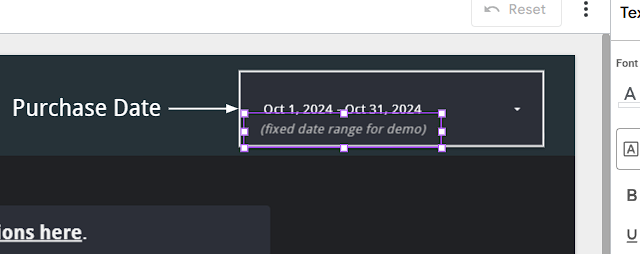
Delete the clear rectangle
Delete the text box
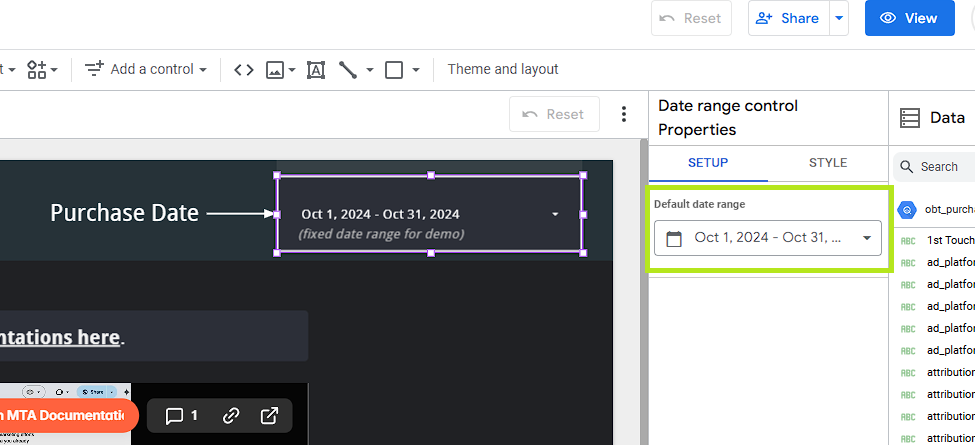
Change the default date range
5
Start analyzing
The four modules and their filters are described in the MTA overview. Questions about the numbers are covered in the MTA FAQs.