> ## Documentation Index
> Fetch the complete documentation index at: https://docs.sourcemedium.com/docs/llms.txt
> Use this file to discover all available pages before exploring further.
# Looker Studio Guide
> Navigate your SourceMedium dashboard, create custom views, and understand credential modes
## Quick Start
Your SourceMedium dashboard is built in Looker Studio (formerly Google Data Studio). Here's what you need to know to get started.
### Navigating the Dashboard
Click the page dropdown (top left) or use the navigation menu to switch between report sections.
Use the date range picker to adjust the reporting period. Most dashboards default to the last 30 days.
Filter by channel, product, region, or other dimensions using the dropdown controls.
Hover over charts to see detailed tooltips with exact values.
**Visual learner?** Check out [this 20 minute Looker Studio crash course](https://www.youtube.com/watch?v=Coe_f79Xc2o\&t=706s) or Google's [quick-start guide](https://support.google.com/looker-studio/answer/9171315?hl=en#zippy=).
***
## Glossary
Understanding these key terms will help you navigate Looker Studio effectively.
A Looker Studio asset that contains a collection of **components** (charts, tables, controls) to present insights from your data.
[Additional Documentation](https://support.google.com/looker-studio/answer/6309867?sjid=14391589404630611402-NC#zippy=%2Cin-this-article)
**Connectors** connect Looker Studio to your underlying data. Connecting creates a **data source** in Looker Studio.
**Data sources** represent a particular instance of a connector—for example, a connection to a specific BigQuery table, a Google Analytics property, or a Google Sheet. Data sources let you configure fields and options, and provide a secure way to share insights with viewers who may not have direct access to the underlying data.
[Additional Documentation](https://support.google.com/looker-studio/answer/6268208?ref_topic=6370331\&sjid=14391589404630611402-NC#zippy=%2Cin-this-article)
A widget you add to a report to display data: **charts**, **tables**, **date range controls**, **filter controls**, etc. Data components get their information from a **data source**.
You can also add **text**, **shapes**, **images**, and [embedded content](https://support.google.com/looker-studio/answer/9132022).
[Additional Documentation](https://support.google.com/looker-studio/answer/6291062?ref_topic=12141289\&sjid=14391589404630611402-NC#zippy=%2Cin-this-article)
A column of data. Looker Studio uses two basic types:
* **Dimensions** — Categories or attributes you want to group by (e.g., `sm_channel`, `product_title`)
* **Metrics** — Numbers that measure things (e.g., `order_net_revenue`, `orders`)
[Additional Documentation](https://support.google.com/looker-studio/answer/7625527?sjid=14391589404630611402-NC#zippy=%2Cin-this-article)
The mechanism determining who can see data in a data source. See [Credential Modes](#credential-modes-explained) below.
[Additional Documentation](https://support.google.com/looker-studio/answer/6371135)
***
## View vs Edit Mode
### View Mode (Default)
* Interact with filters and controls
* Hover over charts for details
* Cannot modify dashboard structure
### Edit Mode
* Modify charts, add new visualizations
* Change data sources and calculations
* **Requires Editor permission**
**Be careful in Edit mode.** Changes affect everyone who views the dashboard. If you want to experiment, make a copy first: **File → Make a copy**.
***
## Credential Modes Explained
Looker Studio dashboards can use two different credential modes for data access. Understanding this helps troubleshoot "no data" issues.
### Owner's Credentials (Recommended)
* **How it works**: Dashboard uses the owner's BigQuery permissions
* **Viewers see**: Data without needing their own BigQuery access
* **Best for**: Sharing dashboards broadly within your organization
### Viewer's Credentials
* **How it works**: Each viewer must have their own BigQuery access
* **Viewers see**: Only data they have permission to access
* **Best for**: Dashboards with sensitive data requiring row-level security
SourceMedium dashboards typically use **Owner's Credentials** so your team can view data without individual BigQuery access.
***
## SourceMedium Templates
If you're on our [Managed Data Warehouse](/data-activation/managed-data-warehouse/overview) solution, SourceMedium provides template reports and data sources:
* [Looker Studio Template Copy Instructions](/data-activation/template-resources/looker-studio-template-copy-instructions)
* [Data Source Template Directory](/data-activation/template-resources/sm-looker-data-source-template-directory)
* [Report Template Directory](/data-activation/template-resources/sm-looker-report-template-directory)
***
## Creating & Managing Data Sources
Data sources connect your reports to data stored in BigQuery, Google Sheets, Google Analytics, etc.
### Creating a New Data Source
**Prerequisite**: You must be logged into a Google account with BigQuery access.
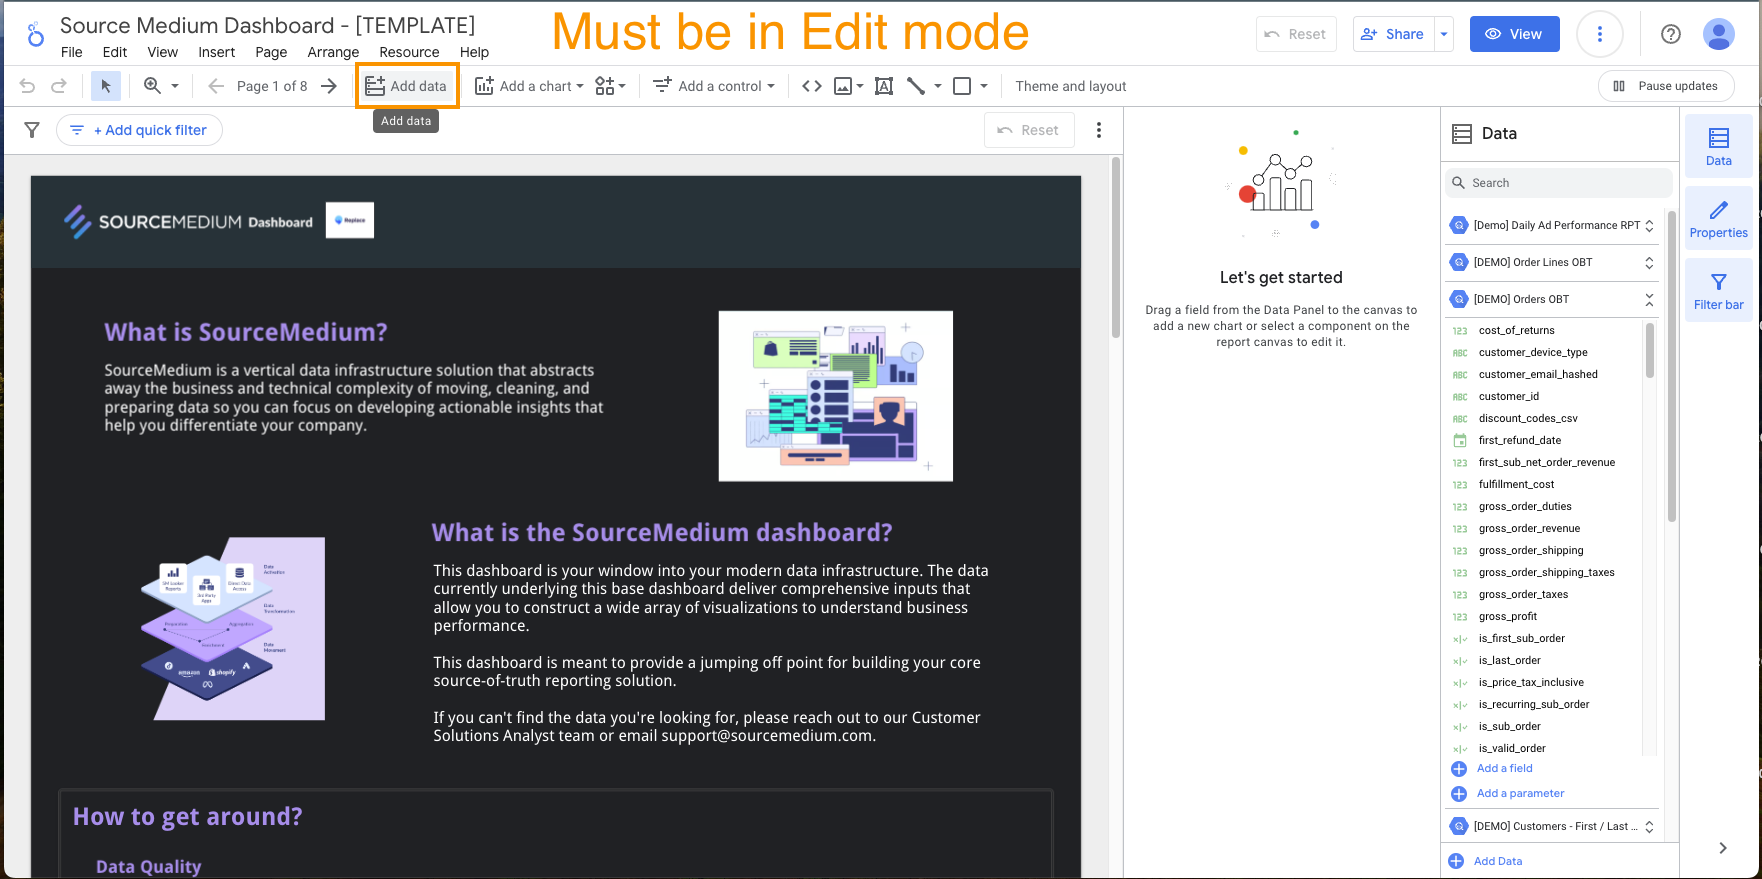
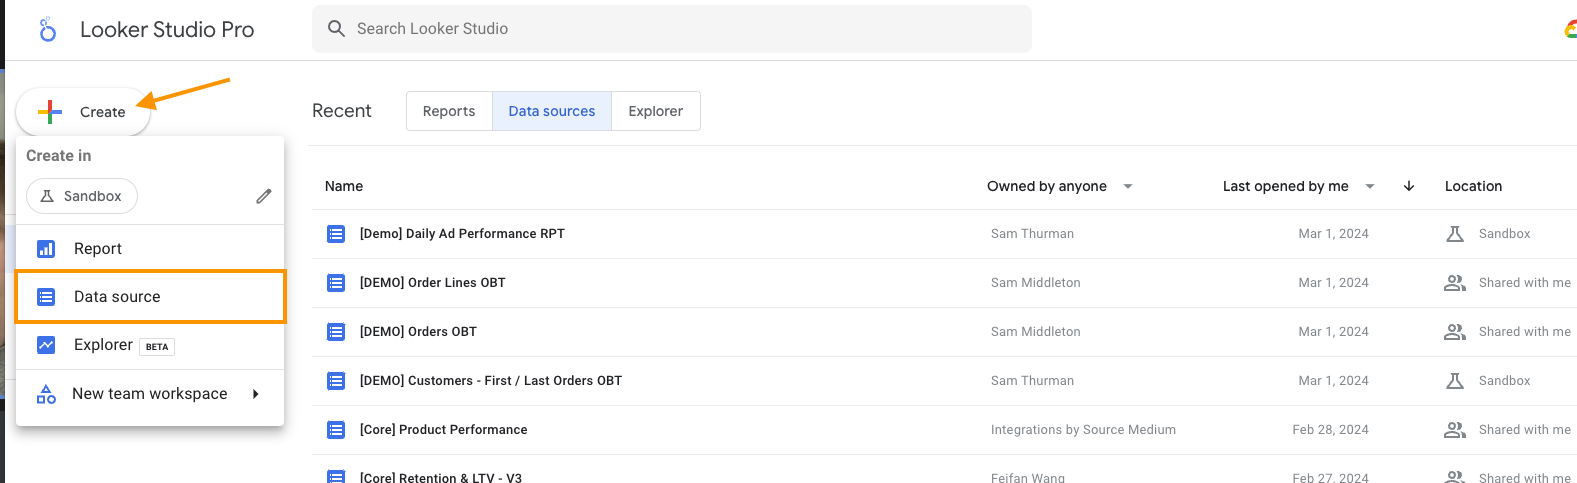
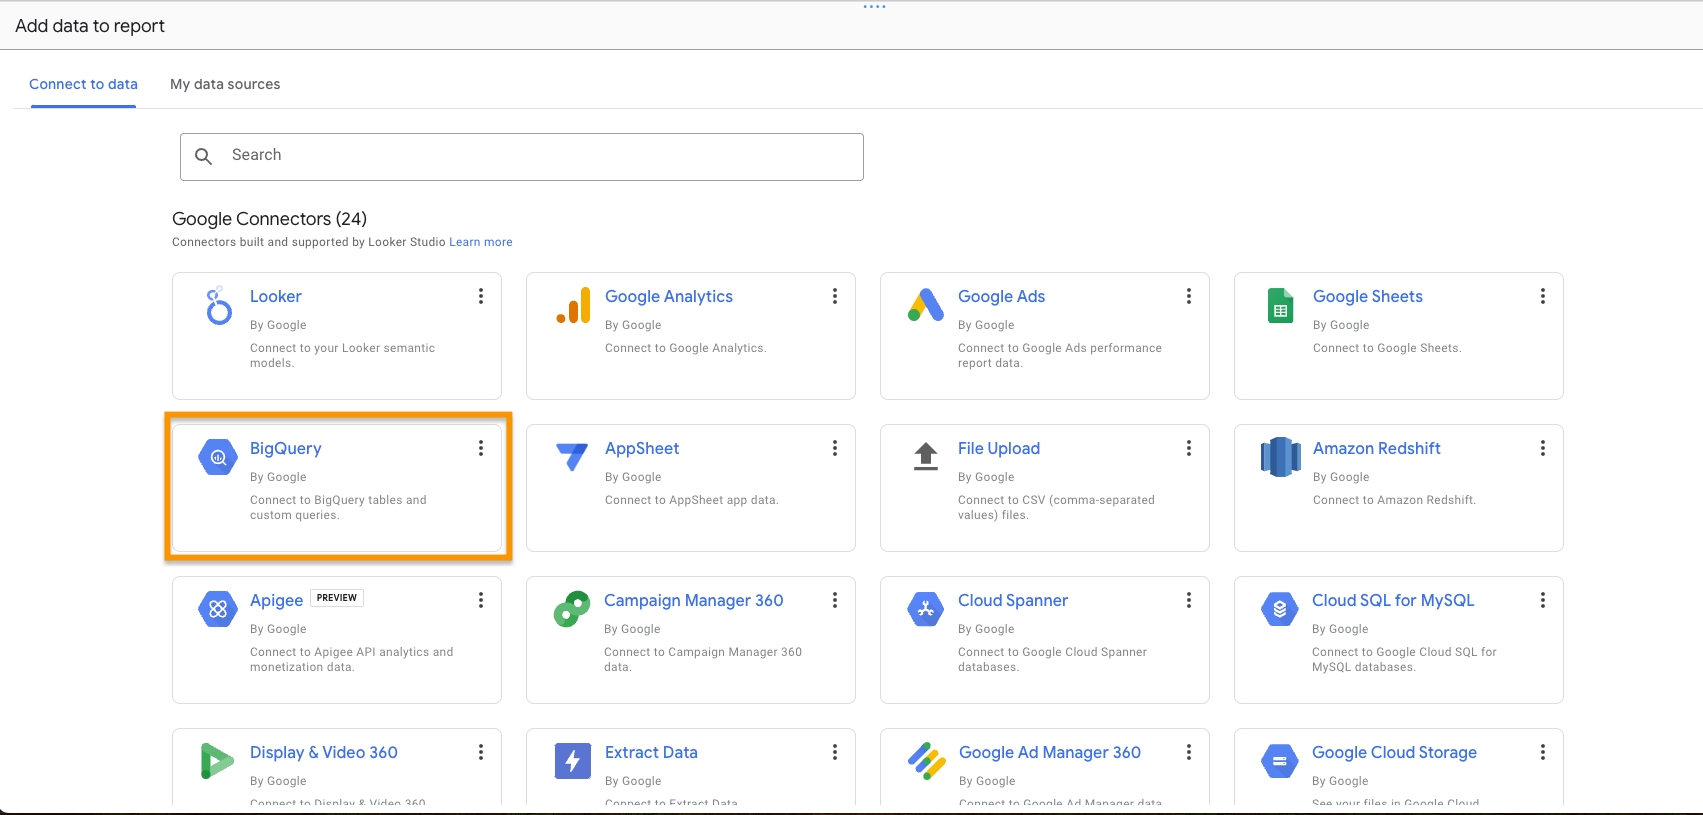 **From an existing table:**
1. Under My Projects, select your SourceMedium warehouse
2. Select a Dataset (e.g., `sm_transformed_v2`) and Table (e.g., `obt_orders`)
3. Click **Add**
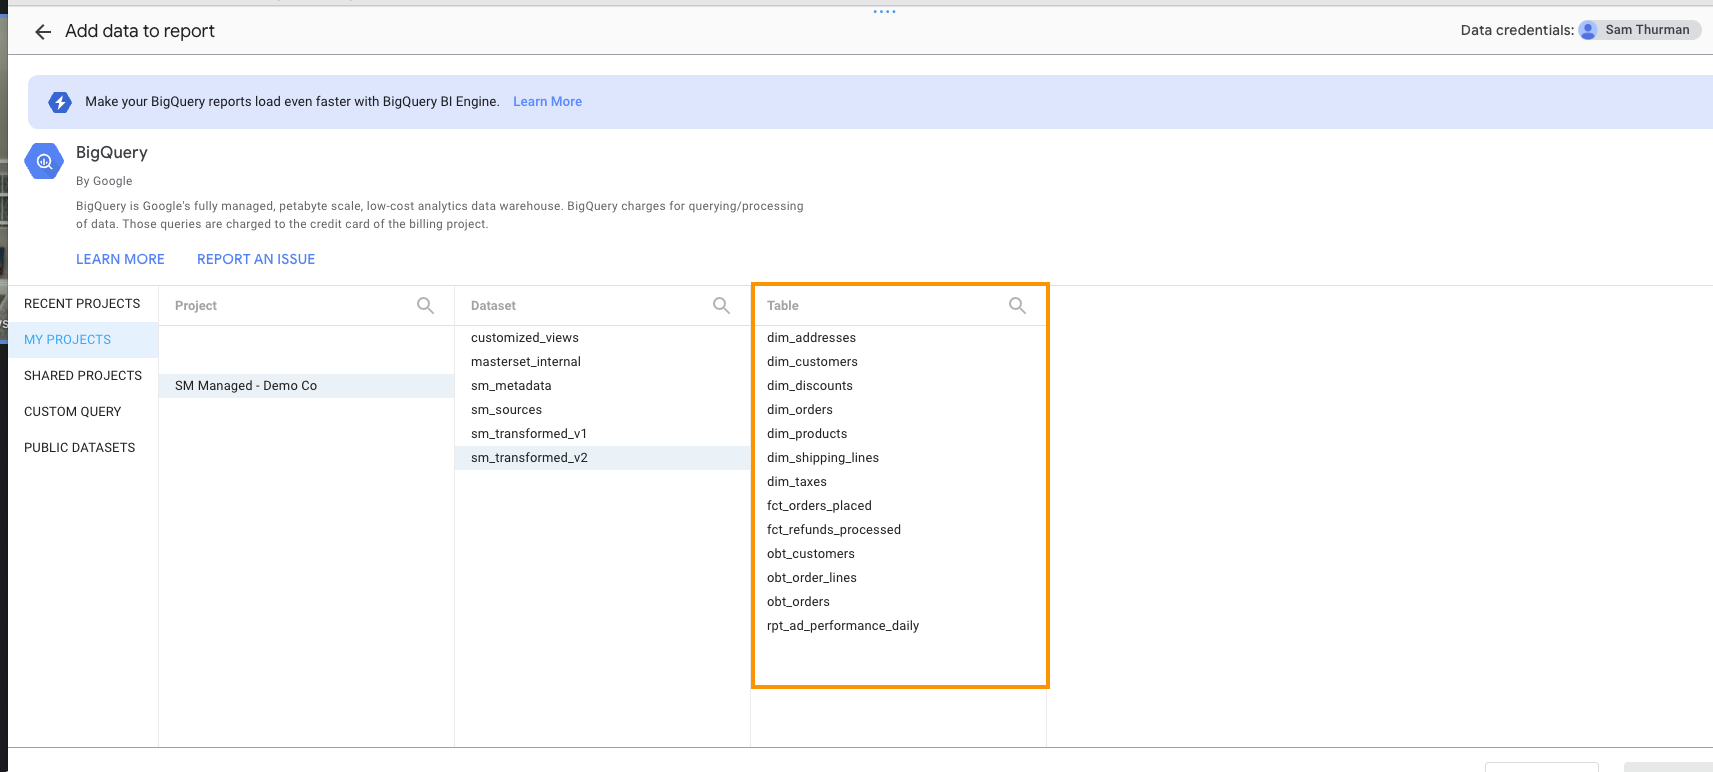
**From an existing table:**
1. Under My Projects, select your SourceMedium warehouse
2. Select a Dataset (e.g., `sm_transformed_v2`) and Table (e.g., `obt_orders`)
3. Click **Add**
 **From a custom query:**
1. Select **Custom Query** from the left menu
2. Select your project
3. Write your SQL query
4. Click **Add**
**From a custom query:**
1. Select **Custom Query** from the left menu
2. Select your project
3. Write your SQL query
4. Click **Add**
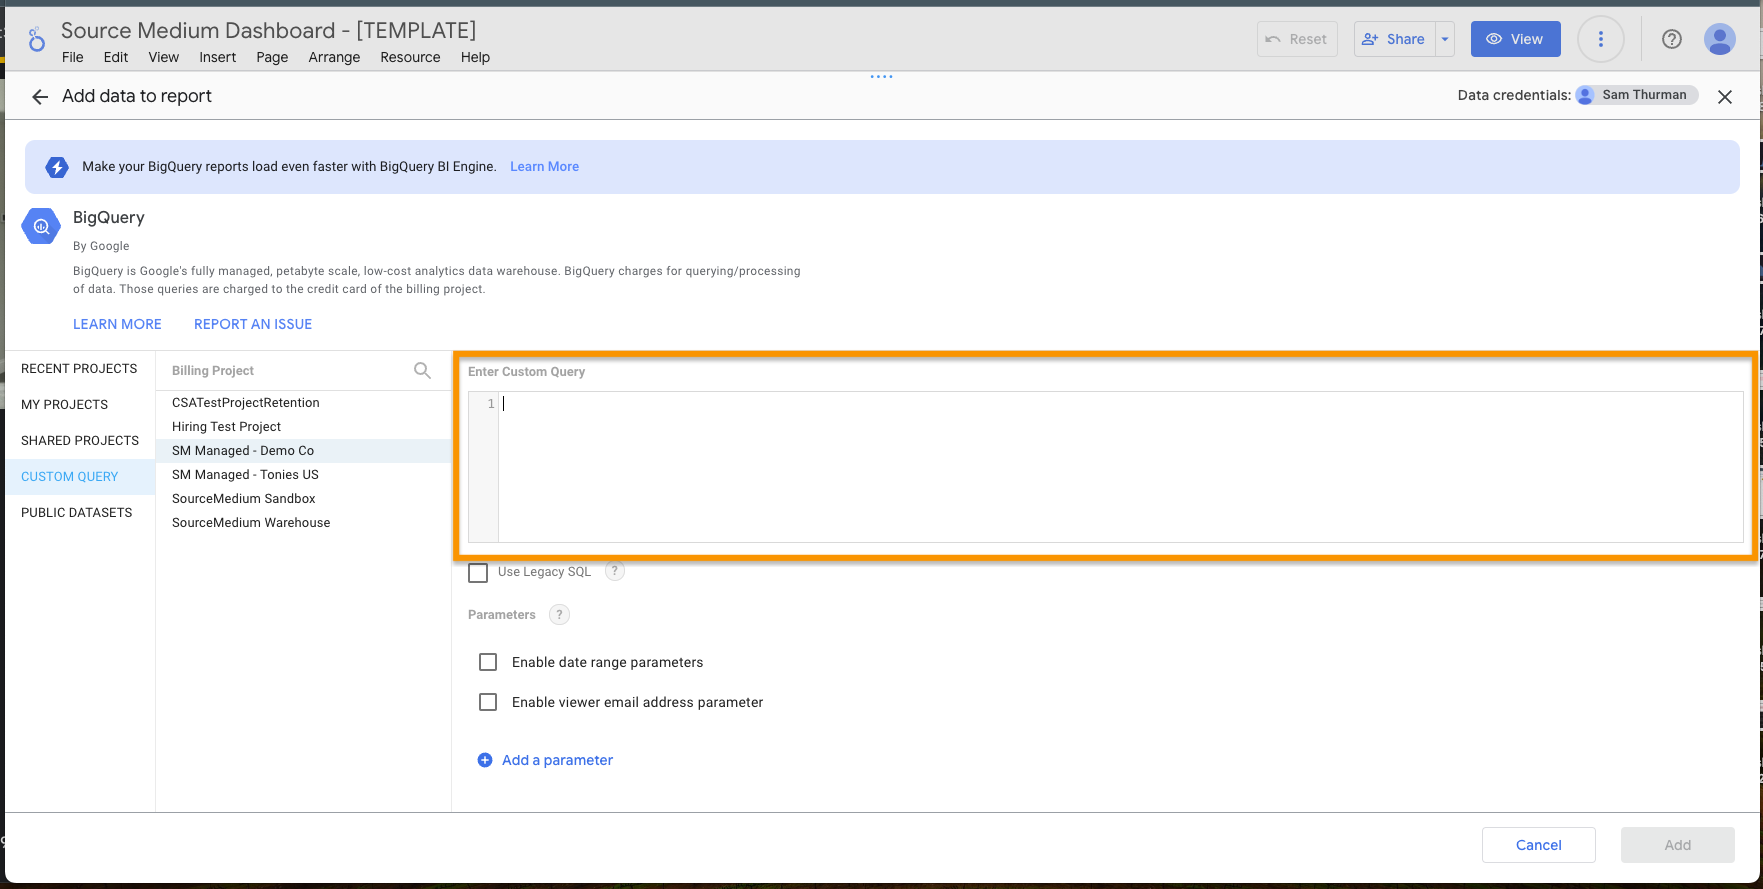 Rename your data source descriptively (e.g., "Orders OBT", "\[MyBrand] Orders") and configure access.
### Data Source Best Practices
Name data sources to clearly indicate the underlying table:
* ✅ `Orders OBT`, `[MyBrand] Orders`, `Ad Performance Daily`
* ❌ `Data Source 1`, `Copy of Copy of Orders`
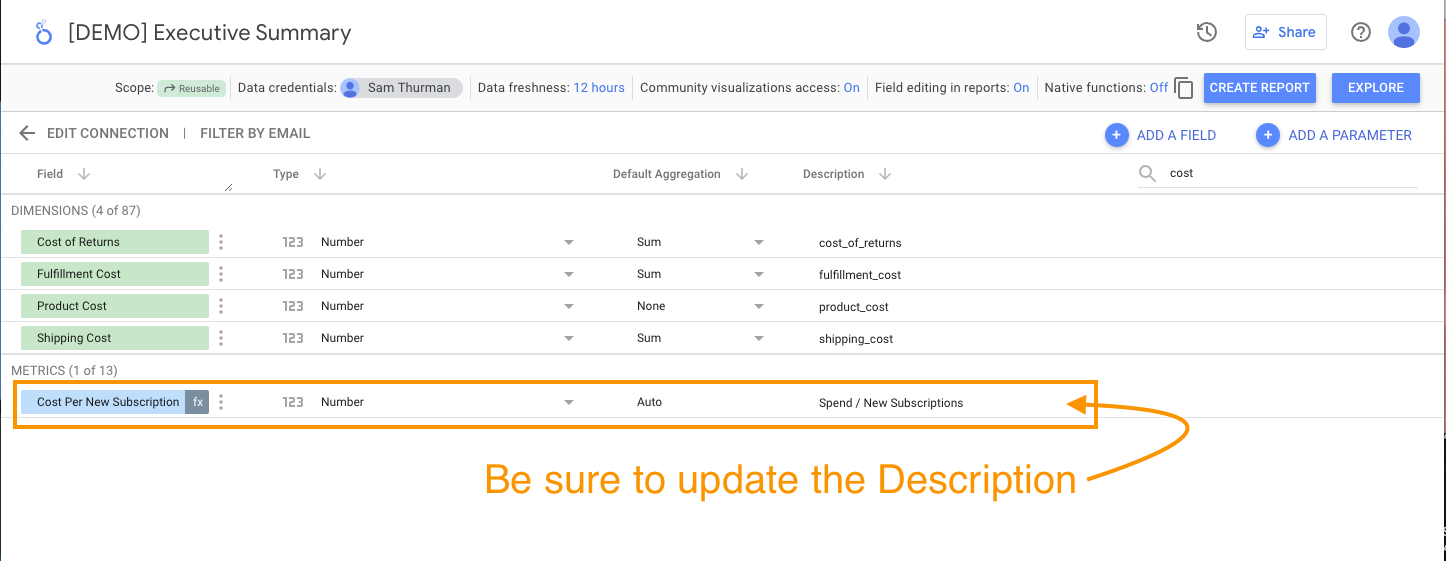
BigQuery fields use `snake_case` (e.g., `order_net_revenue`). You can rename fields for readability, but:
* **Copy the original field name into the Description field** — this is your only reference for looking up definitions
* For calculated fields, include the formula in the Description
* Don't edit Descriptions on SourceMedium template data sources
For production data sources, use a [service account](https://cloud.google.com/iam/docs/service-account-overview) as the Data Credential:
* Ensures access survives when employees leave
* Centralizes permission management
* See [service account setup for Looker Studio](https://support.google.com/looker-studio/answer/10835295?sjid=1005066725261683010-NC#zippy=%2Cin-this-article)
***
## Creating & Editing Reports
### Creating a Report from Scratch
Go to [lookerstudio.google.com](https://lookerstudio.google.com/), click **+ Create** → **Report**
Rename your data source descriptively (e.g., "Orders OBT", "\[MyBrand] Orders") and configure access.
### Data Source Best Practices
Name data sources to clearly indicate the underlying table:
* ✅ `Orders OBT`, `[MyBrand] Orders`, `Ad Performance Daily`
* ❌ `Data Source 1`, `Copy of Copy of Orders`
BigQuery fields use `snake_case` (e.g., `order_net_revenue`). You can rename fields for readability, but:
* **Copy the original field name into the Description field** — this is your only reference for looking up definitions
* For calculated fields, include the formula in the Description
* Don't edit Descriptions on SourceMedium template data sources
For production data sources, use a [service account](https://cloud.google.com/iam/docs/service-account-overview) as the Data Credential:
* Ensures access survives when employees leave
* Centralizes permission management
* See [service account setup for Looker Studio](https://support.google.com/looker-studio/answer/10835295?sjid=1005066725261683010-NC#zippy=%2Cin-this-article)
***
## Creating & Editing Reports
### Creating a Report from Scratch
Go to [lookerstudio.google.com](https://lookerstudio.google.com/), click **+ Create** → **Report**
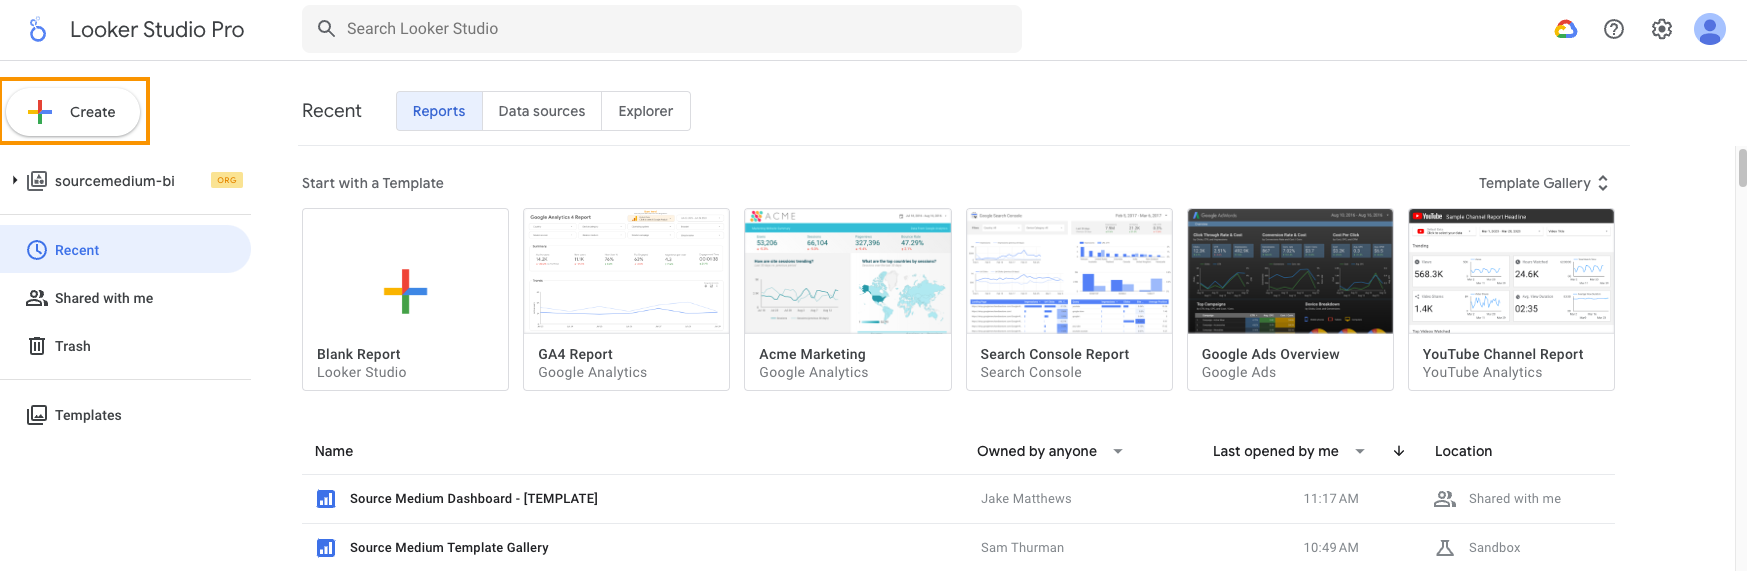 Select an existing data source from **My data sources**, or create a new one via BigQuery.
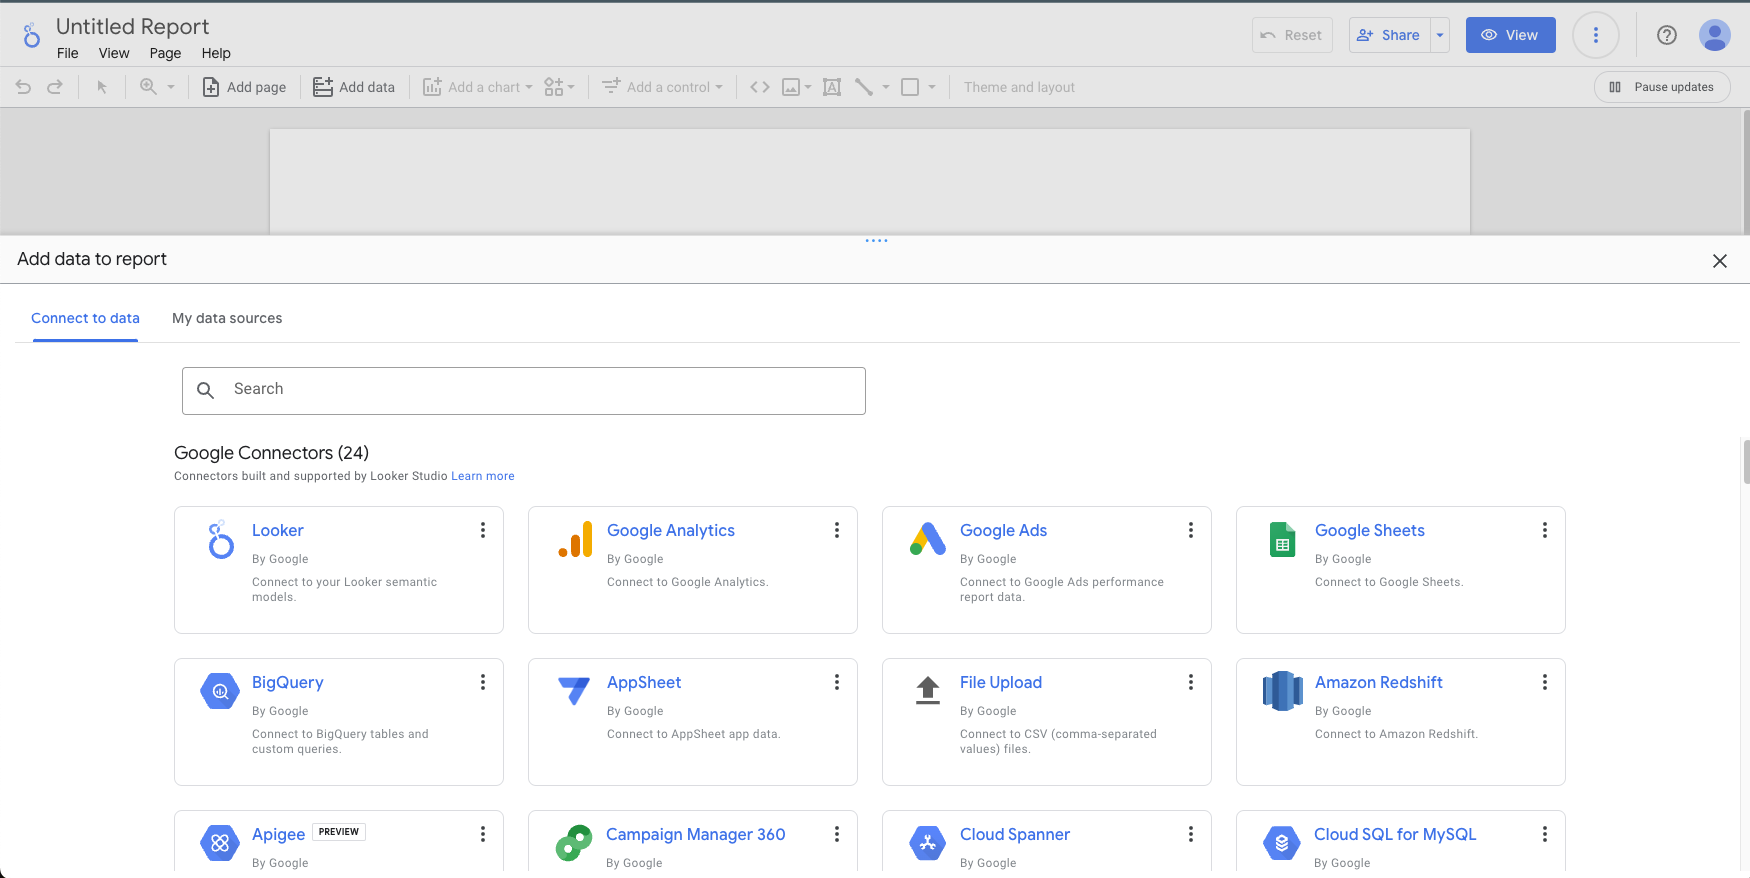 Click the title in the top left to rename immediately—this prevents "Untitled Report" proliferation.
### Adding Charts
1. Click **Add a chart** in the toolbar and select a chart type
Click the title in the top left to rename immediately—this prevents "Untitled Report" proliferation.
### Adding Charts
1. Click **Add a chart** in the toolbar and select a chart type
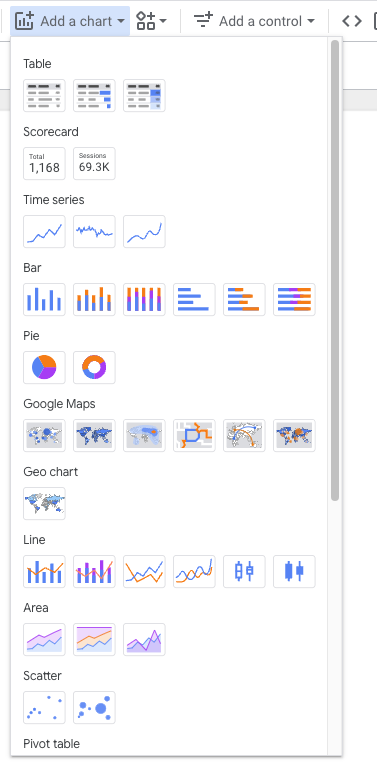 2. Drag the chart to your desired location
3. Configure dimensions and metrics in the **Setup** panel
2. Drag the chart to your desired location
3. Configure dimensions and metrics in the **Setup** panel
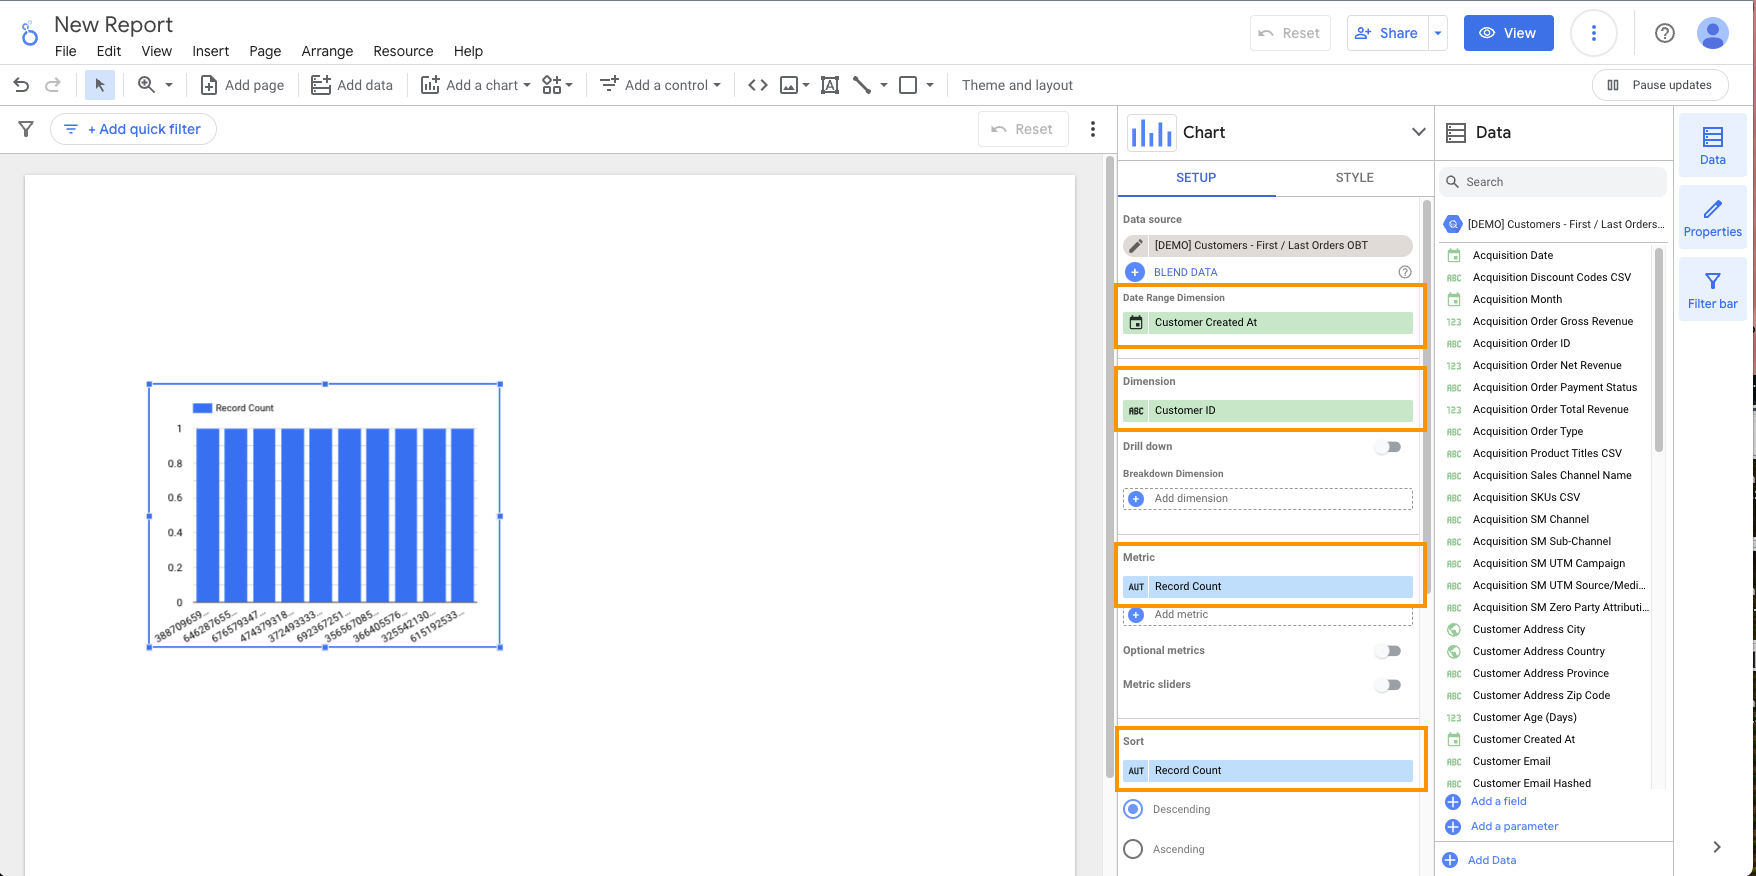 **Always set the Date Range Dimension** on time-based charts. This connects the chart to your date range control.
For more chart types and styling options, see [Looker Studio chart types](https://support.google.com/looker-studio/answer/13590887?hl=en).
### Adding Data Sources to an Existing Report
1. Go to **Resource** → **Manage added data sources**
**Always set the Date Range Dimension** on time-based charts. This connects the chart to your date range control.
For more chart types and styling options, see [Looker Studio chart types](https://support.google.com/looker-studio/answer/13590887?hl=en).
### Adding Data Sources to an Existing Report
1. Go to **Resource** → **Manage added data sources**
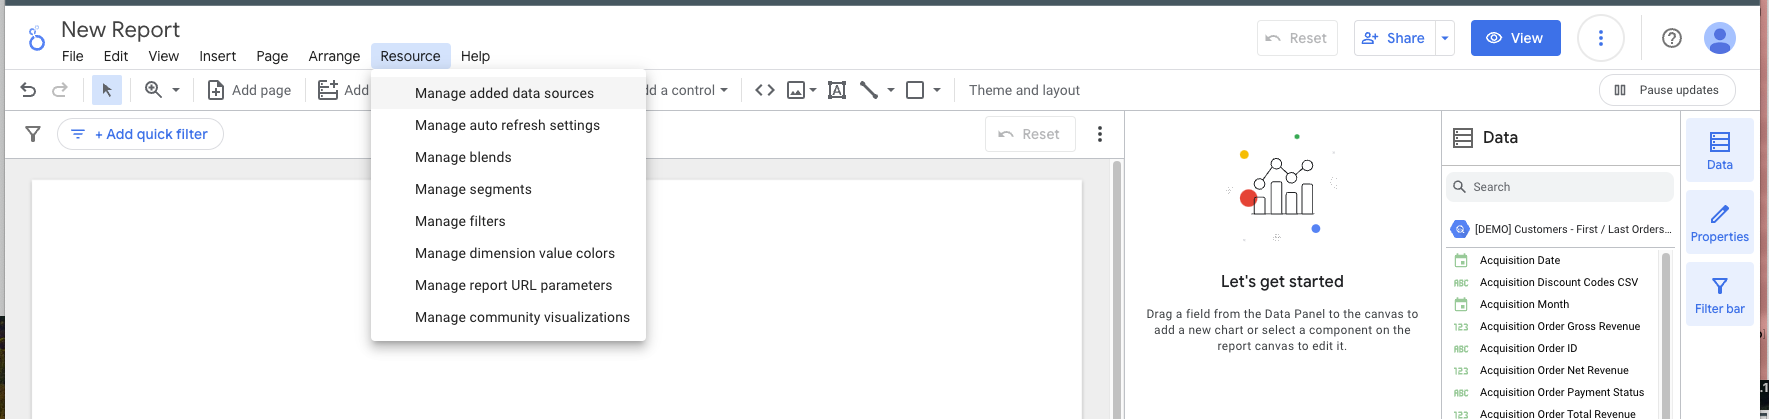 2. Click **Add a Data Source**
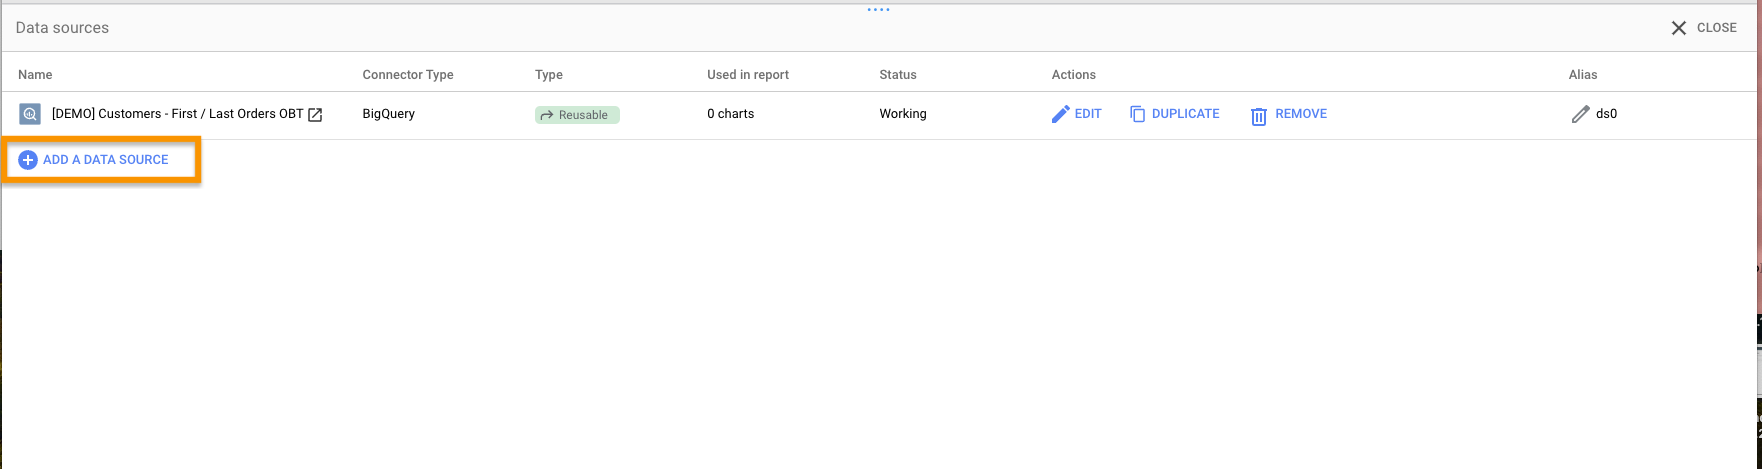 3. Select your connector and configure
***
## Filtering Data
### Filter Controls (Interactive)
Filter controls let **report viewers** filter data themselves using dropdowns, input boxes, etc.
* By default, controls filter all components on the page
* You can group charts with filters for more targeted filtering
* [Control types documentation](https://support.google.com/looker-studio/answer/6312144?hl=en#types-of-controls)
### Object-Level Filters (Fixed)
Object-level filters are **pre-set by editors** and cannot be changed by viewers. They apply at the chart, page, or report level.
* Use when all users should see the same filtered view
* Viewers cannot see, edit, or remove these filters
* [Create and manage filters](https://support.google.com/looker-studio/answer/7326859?hl=en)
***
## Calculated Fields
Create custom metrics and dimensions without writing SQL in your warehouse.
### Chart-Level Calculated Fields
Quick fields created within a single chart—not reusable elsewhere.
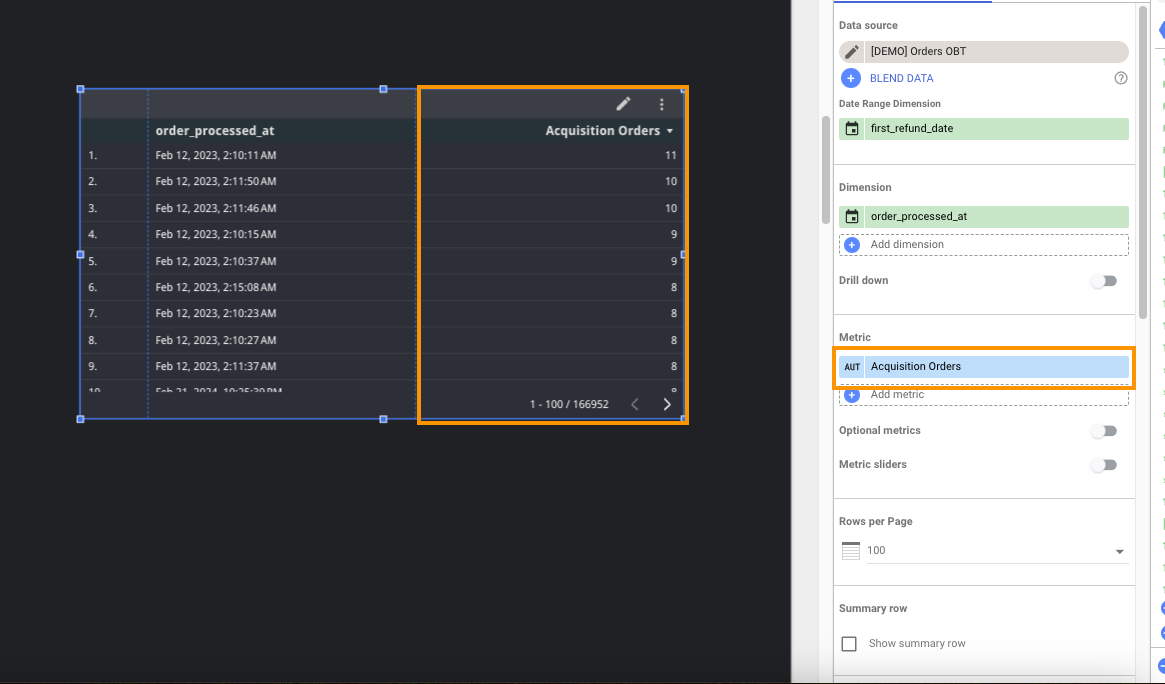
Click on the chart where you want the custom field.
In the Setup panel, click **Add Metric** or **Add Dimension**, then choose **Add Field**.
3. Select your connector and configure
***
## Filtering Data
### Filter Controls (Interactive)
Filter controls let **report viewers** filter data themselves using dropdowns, input boxes, etc.
* By default, controls filter all components on the page
* You can group charts with filters for more targeted filtering
* [Control types documentation](https://support.google.com/looker-studio/answer/6312144?hl=en#types-of-controls)
### Object-Level Filters (Fixed)
Object-level filters are **pre-set by editors** and cannot be changed by viewers. They apply at the chart, page, or report level.
* Use when all users should see the same filtered view
* Viewers cannot see, edit, or remove these filters
* [Create and manage filters](https://support.google.com/looker-studio/answer/7326859?hl=en)
***
## Calculated Fields
Create custom metrics and dimensions without writing SQL in your warehouse.
### Chart-Level Calculated Fields
Quick fields created within a single chart—not reusable elsewhere.
Click on the chart where you want the custom field.
In the Setup panel, click **Add Metric** or **Add Dimension**, then choose **Add Field**.
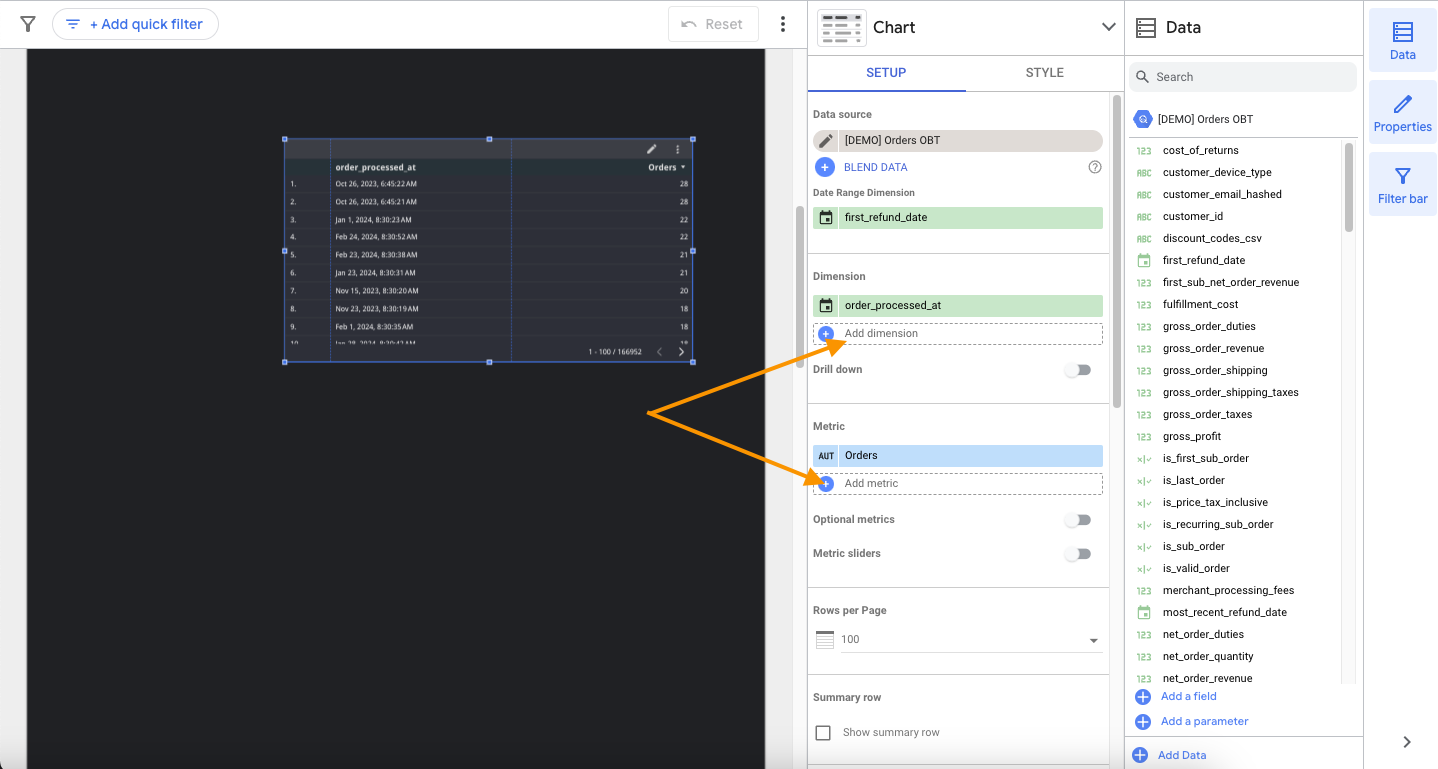 Name the field and enter your formula.
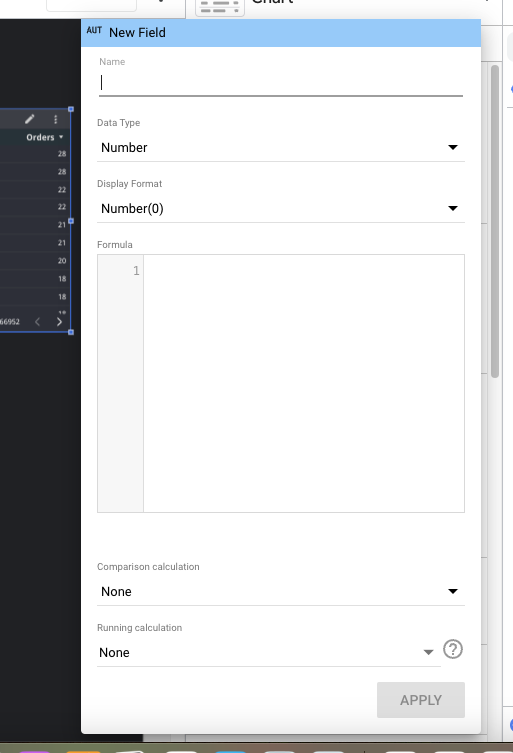 Click **Apply** to add the field to your chart.
 ### Data Source-Level Calculated Fields
Reusable fields available in any report using that data source. **Requires data source Edit access.**
From your report: **Resource** → **Manage added data sources** → **Edit**
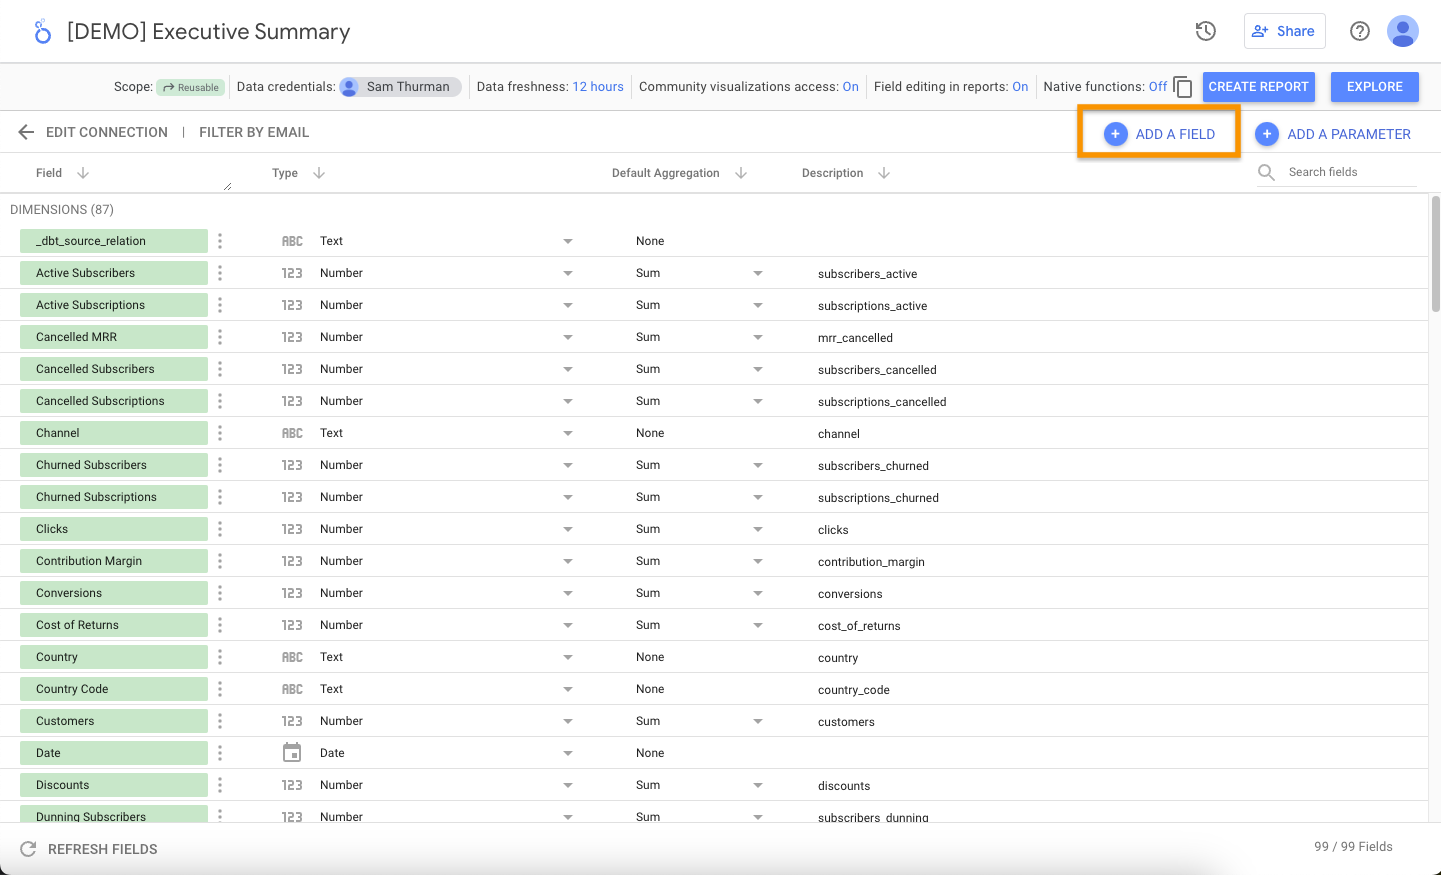
Click **Add a field** → **Add calculated field**
### Data Source-Level Calculated Fields
Reusable fields available in any report using that data source. **Requires data source Edit access.**
From your report: **Resource** → **Manage added data sources** → **Edit**
Click **Add a field** → **Add calculated field**
 Name the field, enter your formula, and click **Save**.
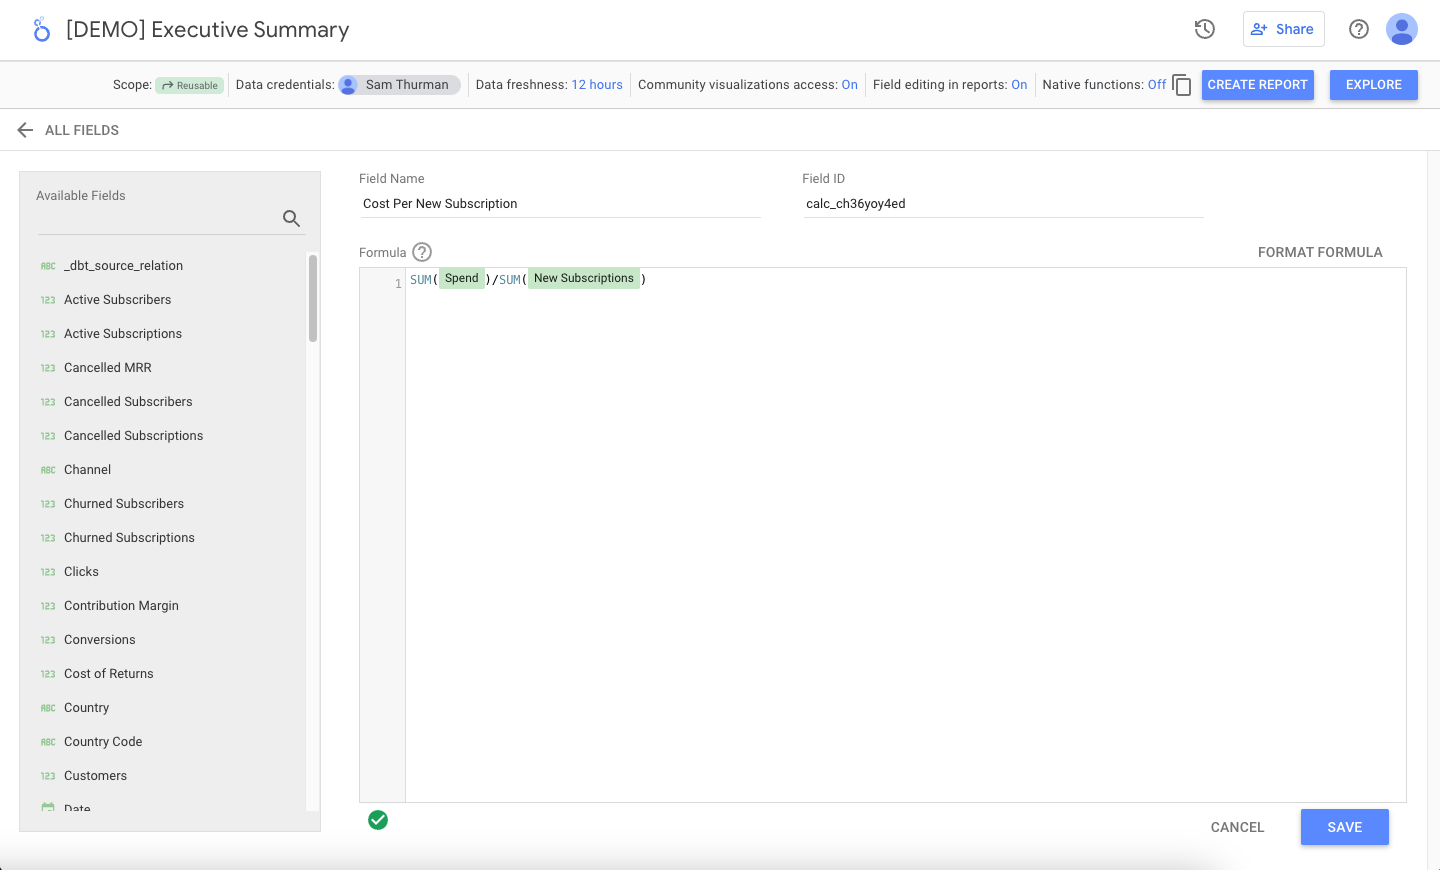 Add the formula to the Description field so viewers understand what it calculates.
 ### Common Formulas
**Average Order Value (AOV)**
```
SUM(order_net_revenue) / COUNT_DISTINCT(sm_order_key)
```
**New Customer Revenue %**
```
SUM(CASE WHEN order_sequence = '1st_order' THEN order_net_revenue ELSE 0 END) / SUM(order_net_revenue)
```
**Year-over-Year Growth**
```
(SUM(order_net_revenue) - SUM(order_net_revenue_ly)) / SUM(order_net_revenue_ly)
```
[Full list of Looker Studio functions](https://support.google.com/looker-studio/table/6379764)
***
## Sharing Your Dashboard
### Permission Levels
| Level | View | Interact | Edit | Share | Delete |
| ------ | ---- | -------- | ---- | ----- | ------ |
| Viewer | ✅ | ✅ | ❌ | ❌ | ❌ |
| Editor | ✅ | ✅ | ✅ | ✅ | ❌ |
| Owner | ✅ | ✅ | ✅ | ✅ | ✅ |
### Sharing a Report
1. Click **Share** (top right)
2. Enter email addresses or Google Group emails
3. Choose permission level
### Common Formulas
**Average Order Value (AOV)**
```
SUM(order_net_revenue) / COUNT_DISTINCT(sm_order_key)
```
**New Customer Revenue %**
```
SUM(CASE WHEN order_sequence = '1st_order' THEN order_net_revenue ELSE 0 END) / SUM(order_net_revenue)
```
**Year-over-Year Growth**
```
(SUM(order_net_revenue) - SUM(order_net_revenue_ly)) / SUM(order_net_revenue_ly)
```
[Full list of Looker Studio functions](https://support.google.com/looker-studio/table/6379764)
***
## Sharing Your Dashboard
### Permission Levels
| Level | View | Interact | Edit | Share | Delete |
| ------ | ---- | -------- | ---- | ----- | ------ |
| Viewer | ✅ | ✅ | ❌ | ❌ | ❌ |
| Editor | ✅ | ✅ | ✅ | ✅ | ❌ |
| Owner | ✅ | ✅ | ✅ | ✅ | ✅ |
### Sharing a Report
1. Click **Share** (top right)
2. Enter email addresses or Google Group emails
3. Choose permission level
 ### Sharing a Data Source
Data source access is **separate** from report access:
* **Viewer**: Can see field names and descriptions
* **Editor**: Can rename fields, edit calculated fields, change the connection
* **Owner**: Can delete the data source, change ownership
[Learn how to share a data source](https://support.google.com/looker-studio/answer/10403278?hl=en)
Data source access ≠ data credentials. Access controls who can modify the data source configuration; credentials control who can see the underlying data.
### Using Google Groups
For teams with 5+ users, manage access via [Google Groups](/onboarding/analytics-tools/google-groups-access-control):
| Group | Purpose |
| -------------------- | --------------------------------------- |
| `company-sm-admins` | Full access to reports and data sources |
| `company-sm-editors` | Report editors, data source viewers |
| `company-sm-viewers` | Report viewers only |
***
## Troubleshooting
**Check these in order:**
1. Date range filter — is it set to a period with data?
2. Other filters — are they excluding all data?
3. Data source credentials — do they have BigQuery access?
4. Contact SourceMedium support if issues persist
Large date ranges or complex calculations slow performance. Try:
* Reducing the date range
* Using pre-aggregated metrics when available
* Removing unnecessary charts from the page
You need **Editor** permission. Contact the dashboard owner or admin.
* Ensure you have Editor permission
* Check your internet connection
* Try refreshing and re-entering Edit mode
In Edit mode:
1. Click the filter control
2. Check **Properties** → **Filter applied to**
3. Ensure relevant charts are selected
* Verify you have data source Viewer or Editor access
* Check the data credentials match your BigQuery permissions
* Permission changes can take time to propagate—sign out and back in
***
## Keyboard Shortcuts
| Action | Shortcut |
| ---------- | -------------- |
| Undo | `Ctrl/Cmd + Z` |
| Redo | `Ctrl/Cmd + Y` |
| Copy | `Ctrl/Cmd + C` |
| Paste | `Ctrl/Cmd + V` |
| Select All | `Ctrl/Cmd + A` |
| Group | `Ctrl/Cmd + G` |
***
## Additional Resources
**Google Documentation:**
* [Looker Studio Help Center](https://support.google.com/looker-studio/)
* [Calculated Field Functions](https://support.google.com/looker-studio/table/6379764)
* [Chart Types Reference](https://support.google.com/looker-studio/answer/13590887?hl=en)
* [Using the Properties Panel](https://support.google.com/looker-studio/answer/6302996?sjid=17257856173080190020-NC)
**SourceMedium Resources:**
* [Google Groups Access Control](/onboarding/analytics-tools/google-groups-access-control)
* [BigQuery Essentials](/onboarding/analytics-tools/bigquery-essentials)
* [Connect BigQuery to Looker Studio](/onboarding/analytics-tools/connect-bigquery-to-looker-studio)
* [Use SourceMedium Data in Other BI Tools](/onboarding/analytics-tools/connect-to-other-bi-tools)
* [Data Tables Reference](/data-activation/data-tables/sm_transformed_v2/index)
### Sharing a Data Source
Data source access is **separate** from report access:
* **Viewer**: Can see field names and descriptions
* **Editor**: Can rename fields, edit calculated fields, change the connection
* **Owner**: Can delete the data source, change ownership
[Learn how to share a data source](https://support.google.com/looker-studio/answer/10403278?hl=en)
Data source access ≠ data credentials. Access controls who can modify the data source configuration; credentials control who can see the underlying data.
### Using Google Groups
For teams with 5+ users, manage access via [Google Groups](/onboarding/analytics-tools/google-groups-access-control):
| Group | Purpose |
| -------------------- | --------------------------------------- |
| `company-sm-admins` | Full access to reports and data sources |
| `company-sm-editors` | Report editors, data source viewers |
| `company-sm-viewers` | Report viewers only |
***
## Troubleshooting
**Check these in order:**
1. Date range filter — is it set to a period with data?
2. Other filters — are they excluding all data?
3. Data source credentials — do they have BigQuery access?
4. Contact SourceMedium support if issues persist
Large date ranges or complex calculations slow performance. Try:
* Reducing the date range
* Using pre-aggregated metrics when available
* Removing unnecessary charts from the page
You need **Editor** permission. Contact the dashboard owner or admin.
* Ensure you have Editor permission
* Check your internet connection
* Try refreshing and re-entering Edit mode
In Edit mode:
1. Click the filter control
2. Check **Properties** → **Filter applied to**
3. Ensure relevant charts are selected
* Verify you have data source Viewer or Editor access
* Check the data credentials match your BigQuery permissions
* Permission changes can take time to propagate—sign out and back in
***
## Keyboard Shortcuts
| Action | Shortcut |
| ---------- | -------------- |
| Undo | `Ctrl/Cmd + Z` |
| Redo | `Ctrl/Cmd + Y` |
| Copy | `Ctrl/Cmd + C` |
| Paste | `Ctrl/Cmd + V` |
| Select All | `Ctrl/Cmd + A` |
| Group | `Ctrl/Cmd + G` |
***
## Additional Resources
**Google Documentation:**
* [Looker Studio Help Center](https://support.google.com/looker-studio/)
* [Calculated Field Functions](https://support.google.com/looker-studio/table/6379764)
* [Chart Types Reference](https://support.google.com/looker-studio/answer/13590887?hl=en)
* [Using the Properties Panel](https://support.google.com/looker-studio/answer/6302996?sjid=17257856173080190020-NC)
**SourceMedium Resources:**
* [Google Groups Access Control](/onboarding/analytics-tools/google-groups-access-control)
* [BigQuery Essentials](/onboarding/analytics-tools/bigquery-essentials)
* [Connect BigQuery to Looker Studio](/onboarding/analytics-tools/connect-bigquery-to-looker-studio)
* [Use SourceMedium Data in Other BI Tools](/onboarding/analytics-tools/connect-to-other-bi-tools)
* [Data Tables Reference](/data-activation/data-tables/sm_transformed_v2/index)